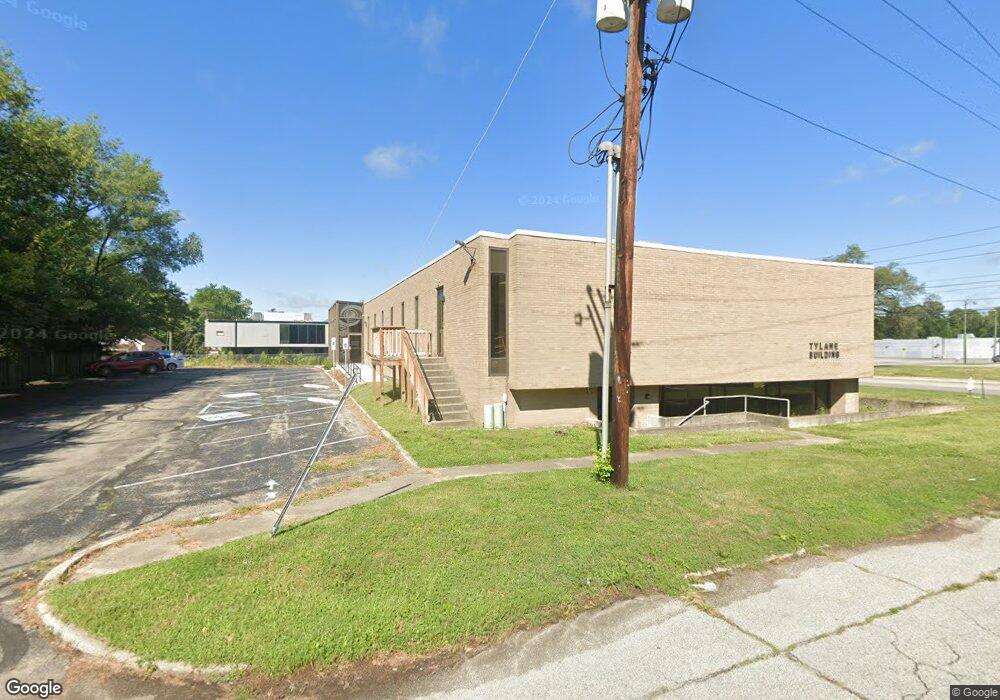
2021 E 52nd St Indianapolis, IN 46205
Fairgrounds Neighborhood
--
Bed
--
Bath
12,693
Sq Ft
0.59
Acres
About This Home
This home is located at 2021 E 52nd St, Indianapolis, IN 46205. 2021 E 52nd St is a home located in Marion County with nearby schools including James Whitcomb Riley School 43, Robert Lee Frost School 106, and Charles Warren Fairbanks School 105.
Ownership History
Date
Name
Owned For
Owner Type
Purchase Details
Closed on
Nov 8, 2019
Sold by
Office Parl Associates Llc
Bought by
New Parafigm Christian Church Inc
Purchase Details
Closed on
Dec 14, 2005
Sold by
Jackson Alphonso
Bought by
Premium Real Estate Group Llc
Purchase Details
Closed on
Jun 20, 2005
Sold by
Wells Fargo Bank Na
Bought by
R E A L Solutions Llc
Purchase Details
Closed on
May 2, 2005
Sold by
Services Aurora Loan
Bought by
Premum Real Estate Group Llc
Home Financials for this Owner
Home Financials are based on the most recent Mortgage that was taken out on this home.
Original Mortgage
$44,788
Interest Rate
6.13%
Mortgage Type
Commercial
Purchase Details
Closed on
Apr 12, 2005
Sold by
Wells Fargo Bank Minnesota
Bought by
Real Solutions Llc
Home Financials for this Owner
Home Financials are based on the most recent Mortgage that was taken out on this home.
Original Mortgage
$44,788
Interest Rate
6.13%
Mortgage Type
Commercial
Create a Home Valuation Report for This Property
The Home Valuation Report is an in-depth analysis detailing your home's value as well as a comparison with similar homes in the area
Home Values in the Area
Average Home Value in this Area
Purchase History
| Date | Buyer | Sale Price | Title Company |
|---|---|---|---|
| New Parafigm Christian Church Inc | $450,000 | First American Title | |
| Premium Real Estate Group Llc | -- | Village Title Inc | |
| R E A L Solutions Llc | -- | None Available | |
| Premum Real Estate Group Llc | -- | None Available | |
| Real Solutions Llc | -- | None Available |
Source: Public Records
Mortgage History
| Date | Status | Borrower | Loan Amount |
|---|---|---|---|
| Previous Owner | Real Solutions Llc | $44,788 |
Source: Public Records
Tax History Compared to Growth
Tax History
| Year | Tax Paid | Tax Assessment Tax Assessment Total Assessment is a certain percentage of the fair market value that is determined by local assessors to be the total taxable value of land and additions on the property. | Land | Improvement |
|---|---|---|---|---|
| 2024 | $391 | $384,000 | $56,400 | $327,600 |
| 2023 | $391 | $380,400 | $56,400 | $324,000 |
| 2022 | $378 | $380,400 | $56,400 | $324,000 |
| 2021 | $365 | $321,600 | $51,200 | $270,400 |
| 2020 | $10,423 | $345,300 | $51,200 | $294,100 |
| 2019 | $7,366 | $236,700 | $51,200 | $185,500 |
| 2018 | $7,578 | $236,700 | $51,200 | $185,500 |
| 2017 | $6,784 | $239,000 | $51,200 | $187,800 |
| 2016 | $6,228 | $231,400 | $51,200 | $180,200 |
| 2014 | $6,948 | $242,100 | $51,200 | $190,900 |
| 2013 | $7,030 | $242,100 | $51,200 | $190,900 |
Source: Public Records
Map
Nearby Homes
- 5168 Caroline Ave
- 5145 Crittenden Ave
- 5038 Caroline Ave
- 5078 Evanston Ave
- 5001 Hillside Ave
- 5214 Norwaldo Ave
- 4919 Caroline Ave
- 5080 Norwaldo Ave
- 1746 E 52nd St
- 5085 Kingsley Dr
- 4931 Norwaldo Ave
- 4965 Kingsley Dr
- 4909 Brouse Ave
- 5131 Ralston Ave
- 5111 Ralston Ave
- 5236 Kingsley Dr
- 4840 Hillside Ave
- 4723 Crittenden Ave
- 4805 Norwaldo Ave
- 5124 Primrose Ave
- 5171 Caroline Ave
- 5173 Caroline Ave
- 5171 Caroline St
- 5164 Caroline Ave
- 5171 Evanston Ave
- 5163 Caroline Ave
- 5161 Caroline St
- 5160 Caroline St
- 5165 Evanston Ave
- 5160 Caroline Ave
- 5161 Caroline Ave
- 2111 E 52nd St
- 2111 E 52nd St
- 0 N Evanston Ave Unit 21415104
- 5159 Evanston Ave
- 5154 Caroline Ave
- 5169 Caroline Ave
- 5169 Caroline Ave
- 5155 Evanston Ave
- 5150 Caroline St