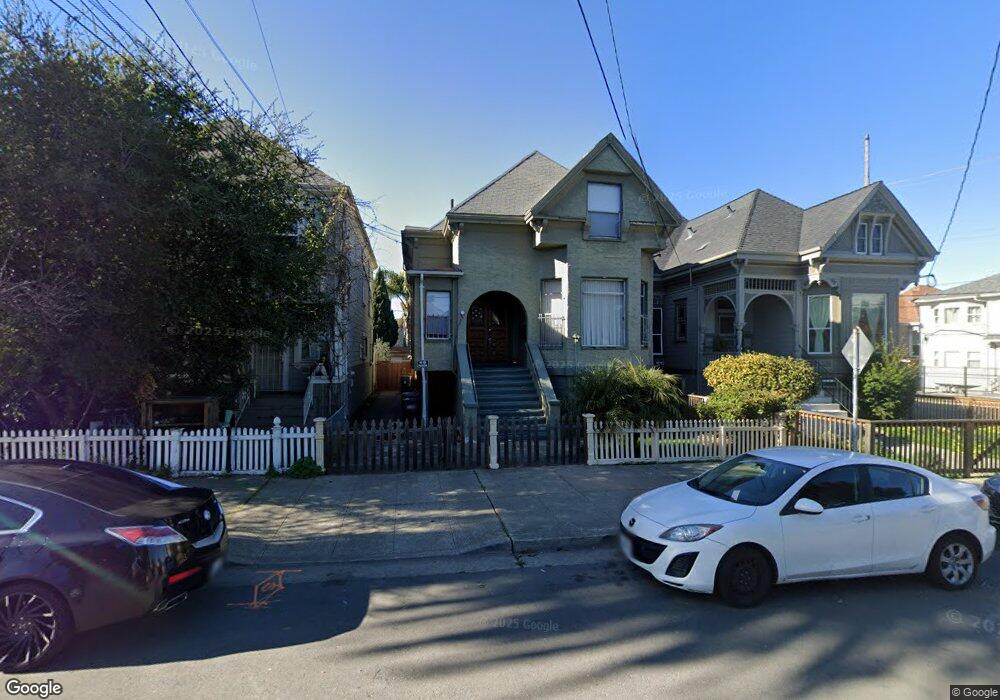
2021 West St Oakland, CA 94612
West Oakland NeighborhoodEstimated Value: $610,000 - $807,000
4
Beds
3
Baths
2,358
Sq Ft
$313/Sq Ft
Est. Value
About This Home
This home is located at 2021 West St, Oakland, CA 94612 and is currently estimated at $738,287, approximately $313 per square foot. 2021 West St is a home located in Alameda County with nearby schools including M. L. King Jr. Elementary School, West Oakland Middle School, and McClymonds High School.
Ownership History
Date
Name
Owned For
Owner Type
Purchase Details
Closed on
May 13, 2009
Sold by
Deutsche Bank National Trust Company
Bought by
Reo Homes Llc
Current Estimated Value
Purchase Details
Closed on
Jul 13, 2007
Sold by
Li Jin Qiang
Bought by
Deutsche Bank National Trust Co and Long Beach Mortgage Loan Trust 2006-7
Purchase Details
Closed on
Jun 20, 2006
Sold by
Chow Yuk Woon and Chow Lisa Ching Yee
Bought by
Li Jin Qiang
Home Financials for this Owner
Home Financials are based on the most recent Mortgage that was taken out on this home.
Original Mortgage
$580,000
Interest Rate
8.62%
Mortgage Type
Balloon
Purchase Details
Closed on
Oct 1, 2005
Sold by
Davis Brenda J
Bought by
Chow Yuk Woon and Chow Lisa Ching Yee
Home Financials for this Owner
Home Financials are based on the most recent Mortgage that was taken out on this home.
Original Mortgage
$584,100
Interest Rate
10.8%
Mortgage Type
Fannie Mae Freddie Mac
Create a Home Valuation Report for This Property
The Home Valuation Report is an in-depth analysis detailing your home's value as well as a comparison with similar homes in the area
Home Values in the Area
Average Home Value in this Area
Purchase History
| Date | Buyer | Sale Price | Title Company |
|---|---|---|---|
| Reo Homes Llc | $175,000 | Chicago Title Company | |
| Deutsche Bank National Trust Co | $630,836 | Lsi Title | |
| Li Jin Qiang | $725,000 | First American Title Co | |
| Chow Yuk Woon | $649,000 | Fidelity National Title Co |
Source: Public Records
Mortgage History
| Date | Status | Borrower | Loan Amount |
|---|---|---|---|
| Previous Owner | Li Jin Qiang | $580,000 | |
| Previous Owner | Chow Yuk Woon | $584,100 |
Source: Public Records
Tax History Compared to Growth
Tax History
| Year | Tax Paid | Tax Assessment Tax Assessment Total Assessment is a certain percentage of the fair market value that is determined by local assessors to be the total taxable value of land and additions on the property. | Land | Improvement |
|---|---|---|---|---|
| 2025 | $5,140 | $225,341 | $67,602 | $157,739 |
| 2024 | $5,140 | $220,924 | $66,277 | $154,647 |
| 2023 | $5,258 | $216,593 | $64,978 | $151,615 |
| 2022 | $4,991 | $212,347 | $63,704 | $148,643 |
| 2021 | $4,584 | $208,184 | $62,455 | $145,729 |
| 2020 | $4,531 | $206,051 | $61,815 | $144,236 |
| 2019 | $4,241 | $202,012 | $60,603 | $141,409 |
| 2018 | $4,155 | $198,051 | $59,415 | $138,636 |
| 2017 | $3,949 | $194,168 | $58,250 | $135,918 |
| 2016 | $3,754 | $190,362 | $57,108 | $133,254 |
| 2015 | $3,730 | $187,504 | $56,251 | $131,253 |
| 2014 | $3,775 | $183,833 | $55,150 | $128,683 |
Source: Public Records
Map
Nearby Homes
- 1915 West St
- 2112 West St Unit 2
- 881 21st St
- 861 W Grand Ave
- 2311 San Pablo Ave
- 850 W Grand Ave Unit 6
- 2327 San Pablo Ave
- 2103 Myrtle St
- 630 Thomas L Berkley Way Unit 102
- 878 Athens Ave
- 710 24th St
- 603 22nd St
- 1424 Market St
- 595 22nd St Unit 595
- 2621 Market St
- 734 25th St
- 2521 San Pablo Ave
- 1511 Jefferson St Unit PH7
- 729 26th St
- 2505 Market St