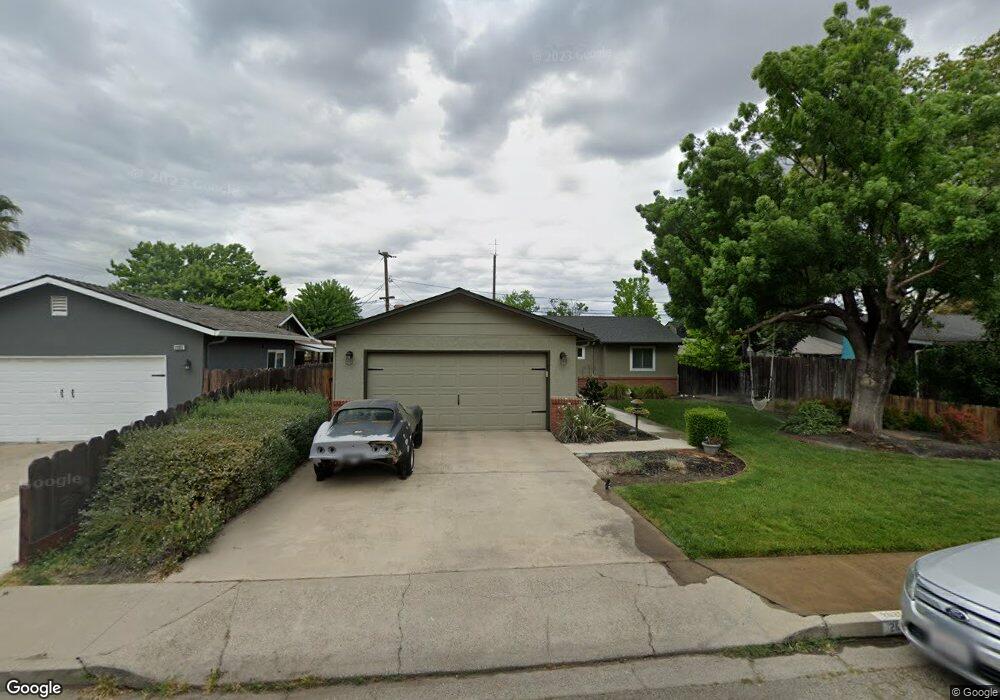
2025 Zinfandel Ln Turlock, CA 95380
Estimated Value: $393,505 - $462,000
4
Beds
2
Baths
1,380
Sq Ft
$317/Sq Ft
Est. Value
About This Home
This home is located at 2025 Zinfandel Ln, Turlock, CA 95380 and is currently estimated at $437,626, approximately $317 per square foot. 2025 Zinfandel Ln is a home located in Stanislaus County with nearby schools including Julien Elementary School, Marvin A. Dutcher Middle School, and Turlock Junior High School.
Ownership History
Date
Name
Owned For
Owner Type
Purchase Details
Closed on
Apr 5, 2012
Sold by
Ness Theodore D and Ness Janet T
Bought by
Nelle Luisa M and L Nelle 2010 Trust
Current Estimated Value
Home Financials for this Owner
Home Financials are based on the most recent Mortgage that was taken out on this home.
Original Mortgage
$116,250
Outstanding Balance
$80,008
Interest Rate
3.91%
Mortgage Type
New Conventional
Estimated Equity
$357,618
Purchase Details
Closed on
Aug 1, 2011
Sold by
Buckles Debra and Estate Of Josephine S House
Bought by
Ness Theodore D and Ness Janet T
Purchase Details
Closed on
Jun 27, 2005
Sold by
House Josephine S and House Joan K
Bought by
House Josephine S and House Joan K
Home Financials for this Owner
Home Financials are based on the most recent Mortgage that was taken out on this home.
Original Mortgage
$28,500
Interest Rate
5.65%
Mortgage Type
Credit Line Revolving
Purchase Details
Closed on
Feb 18, 1998
Sold by
House Josephine
Bought by
House Josephine S and House Joan K
Create a Home Valuation Report for This Property
The Home Valuation Report is an in-depth analysis detailing your home's value as well as a comparison with similar homes in the area
Purchase History
| Date | Buyer | Sale Price | Title Company |
|---|---|---|---|
| Nelle Luisa M | $155,000 | Old Republic Title Company | |
| Ness Theodore D | $81,000 | Chicago Title Company | |
| House Josephine S | -- | Alliance Title Company | |
| House Josephine S | -- | -- |
Source: Public Records
Mortgage History
| Date | Status | Borrower | Loan Amount |
|---|---|---|---|
| Open | Nelle Luisa M | $116,250 | |
| Previous Owner | House Josephine S | $28,500 |
Source: Public Records
Tax History
| Year | Tax Paid | Tax Assessment Tax Assessment Total Assessment is a certain percentage of the fair market value that is determined by local assessors to be the total taxable value of land and additions on the property. | Land | Improvement |
|---|---|---|---|---|
| 2025 | $2,091 | $194,676 | $62,796 | $131,880 |
| 2024 | $2,052 | $190,860 | $61,565 | $129,295 |
| 2023 | $2,049 | $187,118 | $60,358 | $126,760 |
| 2022 | $2,023 | $183,450 | $59,175 | $124,275 |
| 2021 | $1,993 | $179,854 | $58,015 | $121,839 |
| 2020 | $1,979 | $178,011 | $57,421 | $120,590 |
| 2019 | $1,946 | $174,522 | $56,296 | $118,226 |
| 2018 | $1,945 | $171,101 | $55,193 | $115,908 |
| 2017 | $1,899 | $167,747 | $54,111 | $113,636 |
| 2016 | $1,774 | $164,458 | $53,050 | $111,408 |
| 2015 | $1,759 | $161,989 | $52,254 | $109,735 |
| 2014 | $1,741 | $158,817 | $51,231 | $107,586 |
Source: Public Records
Map
Nearby Homes
- 1550 E Marshall St
- 1438 Cahill Ave
- 2521 East Ave
- 2355 El Capitan Dr
- 1598 East Ave
- 2500 Mira Flores Dr
- 401 Bothun Rd
- 411 Bothun Rd
- 716 N Daubenberger Rd
- 1425 Forest Dr
- 951 E Main St
- 1109 Alpha Rd
- 1030 Alpha Rd
- 1460 E Hawkeye Ave
- 599 S Minaret Ave
- 1701 Sylvia Ct
- 1730 Sylvia Ct
- 528 S Minaret Ave
- 861 Wayside Dr
- 1820 N Berkeley Ave
- 2005 Zinfandel Ln
- 2045 Zinfandel Ln
- 2020 Carrigan St
- 2065 Zinfandel Ln
- 2040 Carrigan St
- 2000 Carrigan St
- 2020 Zinfandel Ln
- 2040 Zinfandel Ln
- 2060 Carrigan St
- 2000 Zinfandel Ln
- 2085 Zinfandel Ln
- 2060 Zinfandel Ln
- 1998 Charles Place
- 1995 Charles Place
- 2080 Carrigan St
- 2080 Zinfandel Ln
- 2105 Zinfandel Ln
- 2025 E Marshall St
- 2025 Carrigan St
- 1980 Charles Place
Your Personal Tour Guide
Ask me questions while you tour the home.