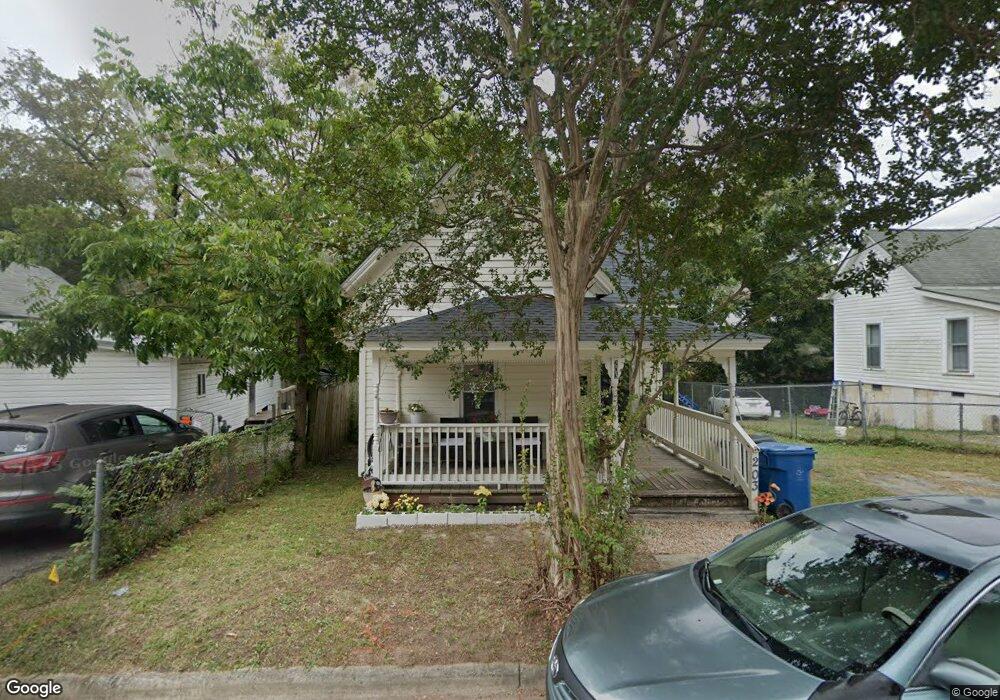
203 Clay St Durham, NC 27703
East Durham NeighborhoodEstimated Value: $194,000 - $504,000
2
Beds
1
Bath
1,664
Sq Ft
$171/Sq Ft
Est. Value
About This Home
This home is located at 203 Clay St, Durham, NC 27703 and is currently estimated at $285,254, approximately $171 per square foot. 203 Clay St is a home located in Durham County with nearby schools including Y E Smith Elementary, W.G. Pearson Elementary School, and Brogden Middle.
Ownership History
Date
Name
Owned For
Owner Type
Purchase Details
Closed on
Nov 20, 2015
Sold by
Matthews Raymond L
Bought by
Mallard Renovations Llc
Current Estimated Value
Purchase Details
Closed on
Mar 26, 2010
Sold by
Harrington Bank Fsb
Bought by
Matthews Raymond L
Home Financials for this Owner
Home Financials are based on the most recent Mortgage that was taken out on this home.
Original Mortgage
$35,000
Interest Rate
4.93%
Mortgage Type
Seller Take Back
Purchase Details
Closed on
Nov 3, 2009
Sold by
Villanueva Robert
Bought by
Harrington Bank Fsb
Purchase Details
Closed on
Feb 4, 2008
Sold by
Villanueva Robert
Bought by
Vlbp Realty Llc
Home Financials for this Owner
Home Financials are based on the most recent Mortgage that was taken out on this home.
Original Mortgage
$66,900
Interest Rate
6.17%
Mortgage Type
Purchase Money Mortgage
Purchase Details
Closed on
Aug 24, 2007
Sold by
Berry John C and Berry Patricia S
Bought by
Vlbp Realty Llc
Create a Home Valuation Report for This Property
The Home Valuation Report is an in-depth analysis detailing your home's value as well as a comparison with similar homes in the area
Home Values in the Area
Average Home Value in this Area
Purchase History
| Date | Buyer | Sale Price | Title Company |
|---|---|---|---|
| Mallard Renovations Llc | $42,000 | Attorney | |
| Matthews Raymond L | $35,000 | None Available | |
| Harrington Bank Fsb | $35,000 | None Available | |
| Vlbp Realty Llc | -- | None Available | |
| Villanueva Robert | -- | None Available | |
| Vlbp Realty Llc | $4,000 | None Available |
Source: Public Records
Mortgage History
| Date | Status | Borrower | Loan Amount |
|---|---|---|---|
| Previous Owner | Matthews Raymond L | $35,000 | |
| Previous Owner | Villanueva Robert | $66,900 |
Source: Public Records
Tax History
| Year | Tax Paid | Tax Assessment Tax Assessment Total Assessment is a certain percentage of the fair market value that is determined by local assessors to be the total taxable value of land and additions on the property. | Land | Improvement |
|---|---|---|---|---|
| 2025 | $2,052 | $206,984 | $98,100 | $108,884 |
| 2024 | $928 | $66,529 | $24,502 | $42,027 |
| 2023 | $871 | $66,529 | $24,502 | $42,027 |
| 2022 | $852 | $66,529 | $24,502 | $42,027 |
| 2021 | $848 | $66,529 | $24,502 | $42,027 |
| 2020 | $828 | $66,529 | $24,502 | $42,027 |
| 2019 | $828 | $66,529 | $24,502 | $42,027 |
| 2018 | $548 | $40,422 | $13,612 | $26,810 |
| 2017 | $544 | $40,422 | $13,612 | $26,810 |
| 2016 | $526 | $40,422 | $13,612 | $26,810 |
| 2015 | $405 | $29,272 | $5,359 | $23,913 |
| 2014 | $405 | $29,272 | $5,359 | $23,913 |
Source: Public Records
Map
Nearby Homes
Your Personal Tour Guide
Ask me questions while you tour the home.