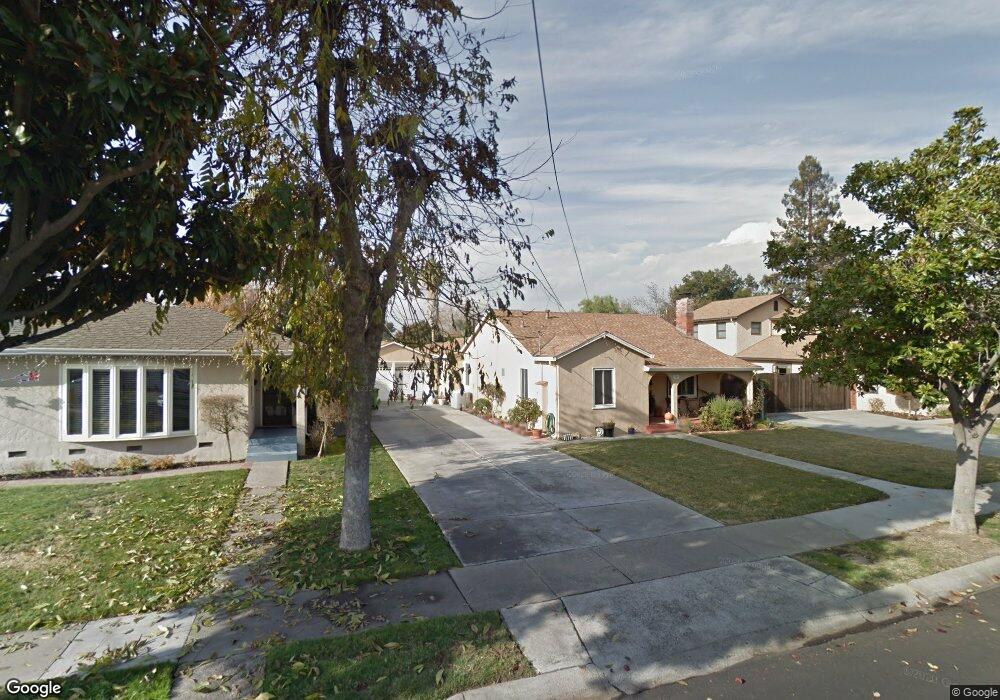
203 N 1st St Campbell, CA 95008
Downtown Campbell NeighborhoodEstimated Value: $1,598,000 - $1,878,000
3
Beds
2
Baths
1,068
Sq Ft
$1,619/Sq Ft
Est. Value
About This Home
This home is located at 203 N 1st St, Campbell, CA 95008 and is currently estimated at $1,729,202, approximately $1,619 per square foot. 203 N 1st St is a home located in Santa Clara County with nearby schools including Rosemary Elementary School, Del Mar High School, and Campbell School of Innovation.
Ownership History
Date
Name
Owned For
Owner Type
Purchase Details
Closed on
Apr 7, 2020
Sold by
Mitoma Anne Bacani and Mitoma Michael
Bought by
Mitoma Anne Bacani and Mitoma Michael
Current Estimated Value
Purchase Details
Closed on
Oct 30, 2001
Sold by
Ruiz Maria T
Bought by
Ruiz Maria T
Create a Home Valuation Report for This Property
The Home Valuation Report is an in-depth analysis detailing your home's value as well as a comparison with similar homes in the area
Home Values in the Area
Average Home Value in this Area
Purchase History
| Date | Buyer | Sale Price | Title Company |
|---|---|---|---|
| Mitoma Anne Bacani | -- | None Available | |
| Ruiz Maria T | -- | First American Title Co |
Source: Public Records
Tax History
| Year | Tax Paid | Tax Assessment Tax Assessment Total Assessment is a certain percentage of the fair market value that is determined by local assessors to be the total taxable value of land and additions on the property. | Land | Improvement |
|---|---|---|---|---|
| 2025 | $2,163 | $94,044 | $33,007 | $61,037 |
| 2024 | $2,163 | $92,201 | $32,360 | $59,841 |
| 2023 | $2,144 | $90,394 | $31,726 | $58,668 |
| 2022 | $2,194 | $88,622 | $31,104 | $57,518 |
| 2021 | $2,136 | $86,886 | $30,495 | $56,391 |
| 2020 | $2,070 | $85,996 | $30,183 | $55,813 |
| 2019 | $2,026 | $84,311 | $29,592 | $54,719 |
| 2018 | $1,961 | $82,659 | $29,012 | $53,647 |
| 2017 | $1,916 | $81,040 | $28,444 | $52,596 |
| 2016 | $1,801 | $79,452 | $27,887 | $51,565 |
| 2015 | $1,745 | $78,260 | $27,469 | $50,791 |
| 2014 | $1,610 | $76,728 | $26,931 | $49,797 |
Source: Public Records
Map
Nearby Homes
- 331 N 1st St Unit 3
- 283 Esther Ave
- 77 S 1st St
- 87 Salice Way
- 101 Sunnyside Ave
- 206 Sunnyside Ave
- 143 Kennedy Ave
- 722 Duncanville Ct
- 63 Braxton Terrace
- 137 Union Ave Unit A
- 75 Union Ave Unit 5
- 186 W Rincon Ave
- 133 Union Ave Unit F
- 188 W Rincon Ave
- 341 Carlyn Ave
- 1460 Regalo Ct
- 160 Quail Hollow Dr Unit 160A
- 425 Queens Ct
- 912 Campisi Way Unit 417
- 848 Apricot Ave Unit B
Your Personal Tour Guide
Ask me questions while you tour the home.