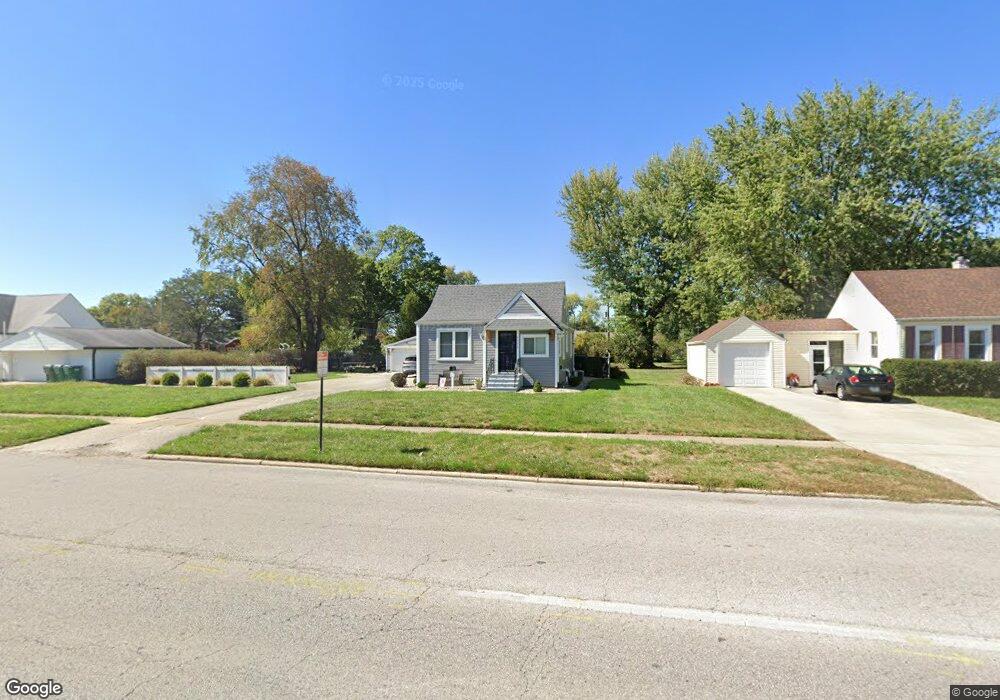
2030 N Lynhurst Dr Indianapolis, IN 46224
Estimated Value: $234,000 - $328,000
2
Beds
2
Baths
928
Sq Ft
$296/Sq Ft
Est. Value
About This Home
This home is located at 2030 N Lynhurst Dr, Indianapolis, IN 46224 and is currently estimated at $274,282, approximately $295 per square foot. 2030 N Lynhurst Dr is a home located in Marion County with nearby schools including Speedway Junior High School, Speedway Senior High School, and St. Christopher School.
Ownership History
Date
Name
Owned For
Owner Type
Purchase Details
Closed on
May 23, 2012
Sold by
Secretary Of Housing & Urban Development
Bought by
Dinsmore Rose Elizabeth
Current Estimated Value
Home Financials for this Owner
Home Financials are based on the most recent Mortgage that was taken out on this home.
Original Mortgage
$77,645
Outstanding Balance
$53,721
Interest Rate
3.87%
Mortgage Type
FHA
Estimated Equity
$220,561
Purchase Details
Closed on
Jan 11, 2012
Sold by
Fifth Third Mortgage Company
Bought by
Secretary Of Housing & Urban Development
Purchase Details
Closed on
Sep 30, 2008
Sold by
Archer Richard L
Bought by
Brown Robert
Home Financials for this Owner
Home Financials are based on the most recent Mortgage that was taken out on this home.
Original Mortgage
$143,390
Interest Rate
6.43%
Mortgage Type
FHA
Purchase Details
Closed on
May 16, 2005
Sold by
Middleton Robert G and Middleton Tamara A
Bought by
Archer Richard L
Home Financials for this Owner
Home Financials are based on the most recent Mortgage that was taken out on this home.
Original Mortgage
$111,750
Interest Rate
5.75%
Mortgage Type
Adjustable Rate Mortgage/ARM
Create a Home Valuation Report for This Property
The Home Valuation Report is an in-depth analysis detailing your home's value as well as a comparison with similar homes in the area
Home Values in the Area
Average Home Value in this Area
Purchase History
| Date | Buyer | Sale Price | Title Company |
|---|---|---|---|
| Dinsmore Rose Elizabeth | -- | None Available | |
| Secretary Of Housing & Urban Development | -- | None Available | |
| Brown Robert | -- | None Available | |
| Archer Richard L | -- | None Available |
Source: Public Records
Mortgage History
| Date | Status | Borrower | Loan Amount |
|---|---|---|---|
| Open | Dinsmore Rose Elizabeth | $77,645 | |
| Previous Owner | Brown Robert | $143,390 | |
| Previous Owner | Archer Richard L | $111,750 |
Source: Public Records
Tax History Compared to Growth
Tax History
| Year | Tax Paid | Tax Assessment Tax Assessment Total Assessment is a certain percentage of the fair market value that is determined by local assessors to be the total taxable value of land and additions on the property. | Land | Improvement |
|---|---|---|---|---|
| 2024 | $2,884 | $218,100 | $19,200 | $198,900 |
| 2023 | $2,884 | $213,300 | $19,200 | $194,100 |
| 2022 | $2,823 | $205,500 | $19,200 | $186,300 |
| 2021 | $2,193 | $162,100 | $19,200 | $142,900 |
| 2020 | $2,037 | $152,300 | $19,200 | $133,100 |
| 2019 | $1,742 | $138,700 | $19,200 | $119,500 |
| 2018 | $1,760 | $137,500 | $19,200 | $118,300 |
| 2017 | $1,686 | $136,500 | $19,200 | $117,300 |
| 2016 | $1,580 | $129,300 | $19,200 | $110,100 |
| 2014 | $1,432 | $122,200 | $19,200 | $103,000 |
| 2013 | $1,391 | $117,300 | $19,200 | $98,100 |
Source: Public Records
Map
Nearby Homes
- 1927 Gerrard Ave
- 5220 Crawfordsville Rd
- 2010 Winton Ave
- 5210 Crawfordsville Rd
- 1811 Christopher Ln
- 2005 Fisher Ave
- 1701 N Lynhurst Dr
- 2126 N Auburn St
- 1829 Fisher Ave
- 6351 Crawfordsville Rd
- 1641 Winton Ave
- 1945 Patton Dr
- 1829 Cunningham Rd
- 4953 Mccray St
- 5124 W 15th St
- 4908 Baxter Dr
- 5555 Maplewood Dr
- n/a Winton St N
- 4956 W 11th St
- 4934 Ford St
- 2040 N Lynhurst Dr
- 2020 N Lynhurst Dr
- 5342 W 20th St
- 2050 N Lynhurst Dr
- 5350 W 20th St
- 2041 N Lynhurst Dr
- 2039 N Lynhurst Dr
- 2045 N Lynhurst Dr
- 2035 N Lynhurst Dr
- 5335 W 20th St
- 2031 N Lynhurst Dr
- 2049 N Lynhurst Dr
- 5343 W 20th St
- 2025 N Lynhurst Dr
- 2055 N Lynhurst Dr
- 5410 W 20th St
- 2021 N Lynhurst Dr
- 5351 W 20th St
- 5254 W 21st St
- 2038 Gerrard Ave