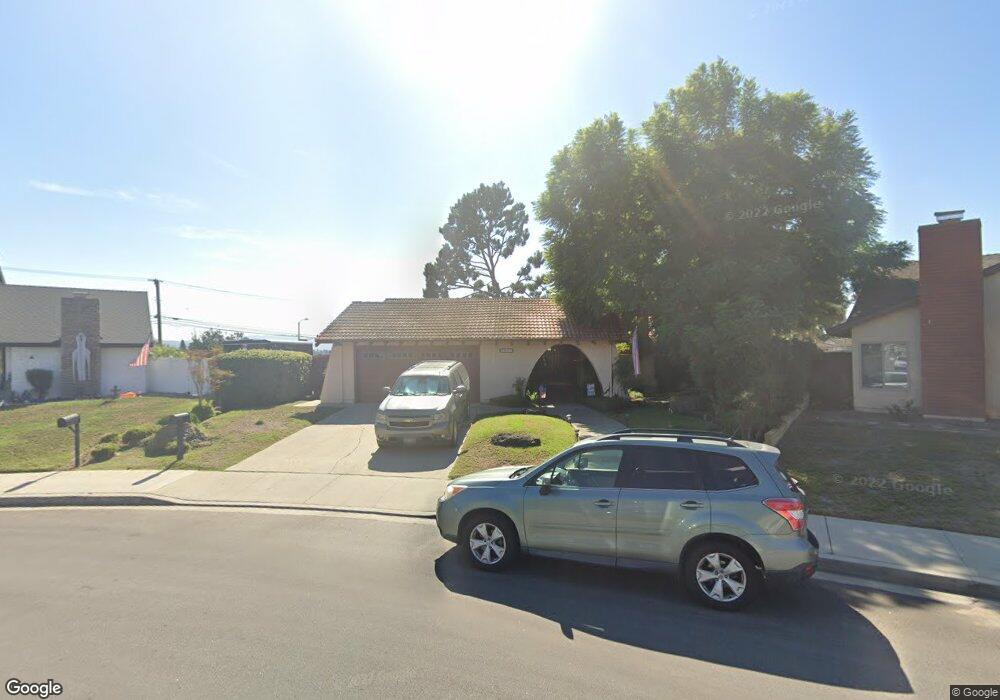
2031 Via Tomas Camarillo, CA 93010
Estimated Value: $982,009 - $1,092,000
4
Beds
2
Baths
1,960
Sq Ft
$532/Sq Ft
Est. Value
About This Home
This home is located at 2031 Via Tomas, Camarillo, CA 93010 and is currently estimated at $1,042,252, approximately $531 per square foot. 2031 Via Tomas is a home located in Ventura County with nearby schools including Camarillo Heights Elementary School, Monte Vista Middle School, and Adolfo Camarillo High School.
Ownership History
Date
Name
Owned For
Owner Type
Purchase Details
Closed on
May 15, 2000
Sold by
Fessenden Judith N
Bought by
Thoben Christopher K and Thoben Nancy J
Current Estimated Value
Home Financials for this Owner
Home Financials are based on the most recent Mortgage that was taken out on this home.
Original Mortgage
$301,750
Outstanding Balance
$103,193
Interest Rate
8%
Estimated Equity
$939,059
Purchase Details
Closed on
Mar 20, 1996
Sold by
Fessenden Judith N
Bought by
Fessenden Judith Nancy
Create a Home Valuation Report for This Property
The Home Valuation Report is an in-depth analysis detailing your home's value as well as a comparison with similar homes in the area
Home Values in the Area
Average Home Value in this Area
Purchase History
| Date | Buyer | Sale Price | Title Company |
|---|---|---|---|
| Thoben Christopher K | $355,000 | Fidelity National Title Co | |
| Fessenden Judith Nancy | -- | -- |
Source: Public Records
Mortgage History
| Date | Status | Borrower | Loan Amount |
|---|---|---|---|
| Open | Thoben Christopher K | $301,750 |
Source: Public Records
Tax History Compared to Growth
Tax History
| Year | Tax Paid | Tax Assessment Tax Assessment Total Assessment is a certain percentage of the fair market value that is determined by local assessors to be the total taxable value of land and additions on the property. | Land | Improvement |
|---|---|---|---|---|
| 2025 | $5,941 | $545,601 | $218,238 | $327,363 |
| 2024 | $5,941 | $534,903 | $213,958 | $320,945 |
| 2023 | $5,727 | $524,415 | $209,763 | $314,652 |
| 2022 | $5,709 | $514,133 | $205,650 | $308,483 |
| 2021 | $5,503 | $504,052 | $201,617 | $302,435 |
| 2020 | $5,483 | $498,885 | $199,550 | $299,335 |
| 2019 | $5,456 | $489,104 | $195,638 | $293,466 |
| 2018 | $5,355 | $479,514 | $191,802 | $287,712 |
| 2017 | $5,039 | $470,113 | $188,042 | $282,071 |
| 2016 | $4,918 | $460,896 | $184,355 | $276,541 |
| 2015 | $4,865 | $453,975 | $181,587 | $272,388 |
| 2014 | -- | $445,084 | $178,031 | $267,053 |
Source: Public Records
Map
Nearby Homes
- 1775 Temple Ave
- 2875 Munson St
- 1690 Loma Dr
- 2251 Camilar Dr
- 511 Beverly Cir
- 1461 Lexington Ct
- 2201 Camilar Dr
- 2113 Euclid Ave
- 2047 Euclid Ave
- 2533 Antonio Dr Unit 302
- 314 Anacapa Dr
- 590 Alosta Dr
- 2713 Antonio Dr Unit 110
- 2713 Antonio Dr Unit 108
- 2713 Antonio Dr Unit 105
- 2722 Antonio Dr
- 350 Highland Hills Dr
- 2803 Antonio Dr Unit 102
- 2803 Antonio Dr Unit 304
- 2174 Wilcox St
- 2710 Via Vela
- 2063 Via Tomas
- 2075 Via Tomas
- 1979 Calaveras Dr
- 2713 Via Vela
- 2004 Calaveras Dr
- 2703 E Landen St
- 2734 Via Vela
- 2729 E Landen St
- 2087 Via Tomas
- 2735 Via Vela
- 2747 E Landen St
- 1981 Calaveras Dr
- 2712 Via Corza
- 2691 E Landen St
- 2648 Via Corza
- 2010 Calaveras Dr
- 2746 Via Vela
- 2765 E Landen St
- 2724 Via Corza