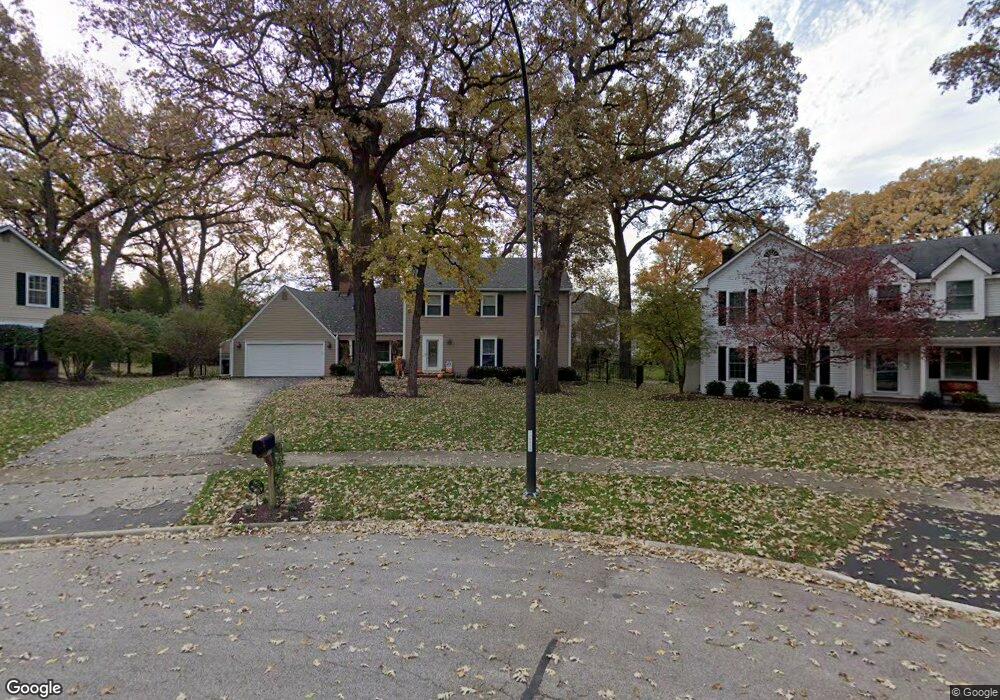
2032 Dichtl Ct Naperville, IL 60565
Hunters Woods NeighborhoodEstimated Value: $665,502 - $750,000
4
Beds
3
Baths
2,429
Sq Ft
$292/Sq Ft
Est. Value
About This Home
This home is located at 2032 Dichtl Ct, Naperville, IL 60565 and is currently estimated at $708,126, approximately $291 per square foot. 2032 Dichtl Ct is a home located in DuPage County with nearby schools including Scott Elementary School, Madison Jr High School, and Naperville Central High School.
Ownership History
Date
Name
Owned For
Owner Type
Purchase Details
Closed on
Sep 25, 2017
Sold by
Czarnecky James T and Czarnecky Laura W
Bought by
Bass Kevin and Bass Laura
Current Estimated Value
Home Financials for this Owner
Home Financials are based on the most recent Mortgage that was taken out on this home.
Original Mortgage
$356,000
Outstanding Balance
$298,784
Interest Rate
4%
Mortgage Type
New Conventional
Estimated Equity
$409,342
Purchase Details
Closed on
May 12, 2005
Sold by
Vitek Ann M and Vitek Michael R
Bought by
Czarnecky James T and Czarnecky Laura W
Home Financials for this Owner
Home Financials are based on the most recent Mortgage that was taken out on this home.
Original Mortgage
$345,600
Interest Rate
5.25%
Mortgage Type
Purchase Money Mortgage
Purchase Details
Closed on
Jun 23, 1998
Sold by
Vitek Michael R and Vitek Ann M
Bought by
Vitek Ann M and Vitek Michael R
Create a Home Valuation Report for This Property
The Home Valuation Report is an in-depth analysis detailing your home's value as well as a comparison with similar homes in the area
Home Values in the Area
Average Home Value in this Area
Purchase History
| Date | Buyer | Sale Price | Title Company |
|---|---|---|---|
| Bass Kevin | -- | Fidelity National Title | |
| Czarnecky James T | $432,000 | -- | |
| Vitek Ann M | -- | -- |
Source: Public Records
Mortgage History
| Date | Status | Borrower | Loan Amount |
|---|---|---|---|
| Open | Bass Kevin | $356,000 | |
| Previous Owner | Czarnecky James T | $345,600 | |
| Closed | Czarnecky James T | $43,200 |
Source: Public Records
Tax History Compared to Growth
Tax History
| Year | Tax Paid | Tax Assessment Tax Assessment Total Assessment is a certain percentage of the fair market value that is determined by local assessors to be the total taxable value of land and additions on the property. | Land | Improvement |
|---|---|---|---|---|
| 2024 | $10,341 | $176,803 | $70,695 | $106,108 |
| 2023 | $9,965 | $161,360 | $64,520 | $96,840 |
| 2022 | $9,156 | $147,470 | $58,970 | $88,500 |
| 2021 | $8,821 | $141,890 | $56,740 | $85,150 |
| 2020 | $8,632 | $139,340 | $55,720 | $83,620 |
| 2019 | $8,380 | $133,310 | $53,310 | $80,000 |
| 2018 | $8,222 | $130,880 | $52,340 | $78,540 |
| 2017 | $8,055 | $126,460 | $50,570 | $75,890 |
| 2016 | $7,894 | $121,890 | $48,740 | $73,150 |
| 2015 | $7,842 | $114,790 | $45,900 | $68,890 |
| 2014 | $7,690 | $109,320 | $43,710 | $65,610 |
| 2013 | $7,575 | $109,580 | $43,810 | $65,770 |
Source: Public Records
Map
Nearby Homes
- 816 Spindletree Ave
- 805 Potomac Ave
- 705 Potomac Ave
- 2230 Keim Rd Unit 3B
- 517 Sheffield Rd
- 336 Brooklea Ct
- 743 Arlington Ave
- 621 Bourbon Ct
- 302 Carriage Hill Rd
- 2280 Barth Dr
- 1120 Colgate Ct
- 342 Dilorenzo Dr
- 431 Orleans Ave
- 456 Timber Trail Ct
- 1717 Drake Ct
- 710 Alexandria Dr
- 2279 Kaskaskia Ct
- 138 E Bailey Rd Unit M
- 158 E Bailey Rd Unit F
- 144 E Bailey Rd Unit L
- 2028 Dichtl Ct
- 2033 Dichtl Ct
- 2087 Camellia Ct
- 2024 Dichtl Ct
- 2086 Camellia Ct
- 2029 Fairoak Ct
- 2029 Dichtl Ct
- 2033 Fairoak Ct
- 2025 Dichtl Ct
- 2025 Fairoak Ct
- 2020 Dichtl Ct
- 2091 Camellia Ct Unit 4
- 2090 Camellia Ct
- 2085 Persimmon Ct
- 739 Spindletree Ave
- 2021 Fairoak Ct
- 2021 Dichtl Ct
- 2016 Dichtl Ct
- 2081 Persimmon Ct
- 2034 Fairoak Ct