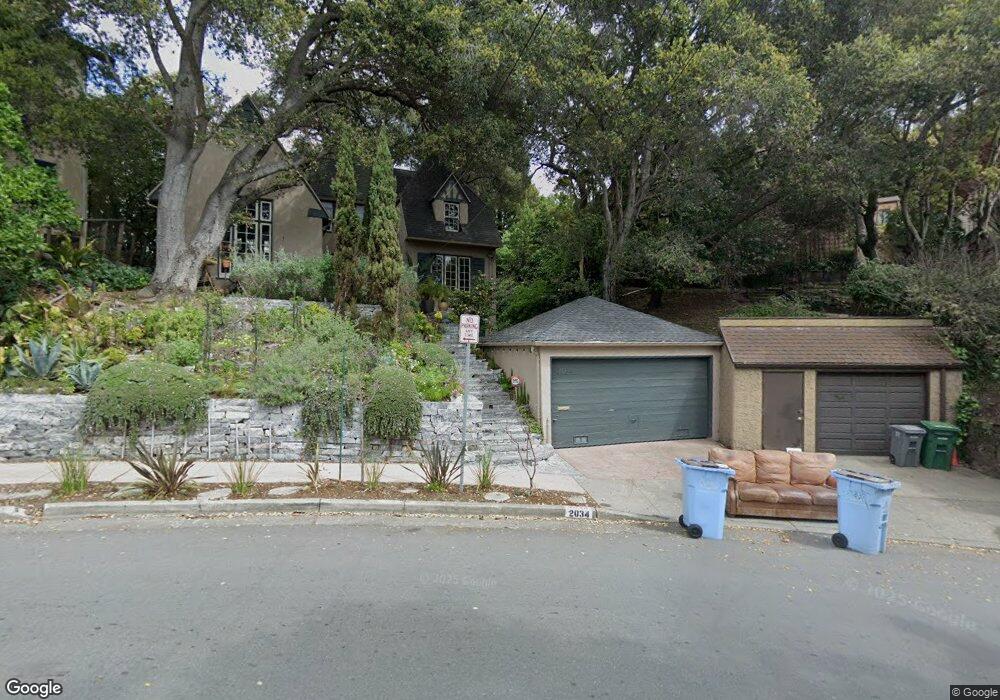
2034 Del Norte St Berkeley, CA 94707
Berkeley Hills NeighborhoodEstimated Value: $1,673,000 - $1,870,000
2
Beds
2
Baths
1,741
Sq Ft
$1,020/Sq Ft
Est. Value
About This Home
This home is located at 2034 Del Norte St, Berkeley, CA 94707 and is currently estimated at $1,775,968, approximately $1,020 per square foot. 2034 Del Norte St is a home located in Alameda County with nearby schools including Cragmont Elementary School, Berkeley Arts Magnet at Whittier School, and Washington Elementary School.
Ownership History
Date
Name
Owned For
Owner Type
Purchase Details
Closed on
Oct 30, 2018
Sold by
Mcfarland Sean E
Bought by
Mcfarland Sean E and Mcfarland Lori Smith
Current Estimated Value
Home Financials for this Owner
Home Financials are based on the most recent Mortgage that was taken out on this home.
Original Mortgage
$150,000
Outstanding Balance
$113,267
Interest Rate
4.6%
Mortgage Type
Stand Alone Second
Estimated Equity
$1,662,701
Purchase Details
Closed on
Feb 11, 2003
Sold by
Smith Lauren
Bought by
Mcfarland Sean E
Home Financials for this Owner
Home Financials are based on the most recent Mortgage that was taken out on this home.
Original Mortgage
$570,000
Outstanding Balance
$243,048
Interest Rate
5.89%
Estimated Equity
$1,532,920
Purchase Details
Closed on
Mar 22, 2001
Sold by
Chacona Robert G and Estate Of Walter K Yost
Bought by
Mcfarland Sean E and Smith Lauren
Home Financials for this Owner
Home Financials are based on the most recent Mortgage that was taken out on this home.
Original Mortgage
$488,000
Interest Rate
7.06%
Create a Home Valuation Report for This Property
The Home Valuation Report is an in-depth analysis detailing your home's value as well as a comparison with similar homes in the area
Home Values in the Area
Average Home Value in this Area
Purchase History
We collect this data history from publicly available records. To have your information removed, we recommend requesting removal directly through your county’s website.
| Date | Buyer | Sale Price | Title Company |
|---|---|---|---|
| Mcfarland Sean E | -- | Servicelink | |
| Mcfarland Sean E | -- | Placer Title Company | |
| Mcfarland Sean E | $610,000 | Placer Title Company |
Source: Public Records
Mortgage History
We collect this data history from publicly available records. To have your information removed, we recommend requesting removal directly through your county’s website.
| Date | Status | Borrower | Loan Amount |
|---|---|---|---|
| Open | Mcfarland Sean E | $150,000 | |
| Open | Mcfarland Sean E | $570,000 | |
| Closed | Mcfarland Sean E | $488,000 | |
| Closed | Mcfarland Sean E | $61,000 |
Source: Public Records
Tax History
| Year | Tax Paid | Tax Assessment Tax Assessment Total Assessment is a certain percentage of the fair market value that is determined by local assessors to be the total taxable value of land and additions on the property. | Land | Improvement |
|---|---|---|---|---|
| 2025 | $14,393 | $912,104 | $275,731 | $643,373 |
| 2024 | $14,393 | $894,085 | $270,325 | $630,760 |
| 2023 | $14,087 | $883,420 | $265,026 | $618,394 |
| 2022 | $13,822 | $859,101 | $259,830 | $606,271 |
| 2021 | $13,848 | $842,120 | $254,736 | $594,384 |
| 2020 | $13,081 | $840,414 | $252,124 | $588,290 |
| 2019 | $12,540 | $823,938 | $247,181 | $576,757 |
| 2018 | $12,323 | $807,785 | $242,335 | $565,450 |
| 2017 | $11,893 | $791,950 | $237,585 | $554,365 |
| 2016 | $11,496 | $776,425 | $232,927 | $543,498 |
| 2015 | $11,339 | $764,768 | $229,430 | $535,338 |
| 2014 | $11,204 | $749,793 | $224,938 | $524,855 |
Source: Public Records
Map
Nearby Homes
- 2114 Marin Ave
- 961 Arlington Ave
- 899 Arlington Ave
- 1001 Cragmont Ave
- 813 San Diego Rd
- 2370 Marin Ave
- 2301 Oak St
- 962 Regal Rd
- 900 Euclid Ave
- 875 Colusa Ave Unit 4
- 1106 Cragmont Ave
- 840 Hilldale Ave
- 960 Keeler Ave
- 1858 San Lorenzo Ave
- 1055 Sterling Ave
- 1408 Henry St
- 1915 Thousand Oaks Blvd
- 1800 San Lorenzo Ave
- 801 Keeler Ave
- 1126 Keeler Ave
- 2027 Los Angeles Ave
- 2035 Los Angeles Ave
- 2023 Los Angeles Ave
- 2039 Los Angeles Ave
- 912 Shattuck Ave
- 920 Shattuck Ave
- 922 Shattuck Ave
- 908 Shattuck Ave
- 2019 Los Angeles Ave
- 2026 Los Angeles Ave
- 2043 Los Angeles Ave
- 926 Shattuck Ave
- 2022 Los Angeles Ave
- 2018 Los Angeles Ave
- 1000 Mariposa Ave
- 904 Shattuck Ave
- 2015 Los Angeles Ave
- 930 Shattuck Ave
- 2047 Los Angeles Ave
- 1008 Mariposa Ave
Your Personal Tour Guide
Ask me questions while you tour the home.