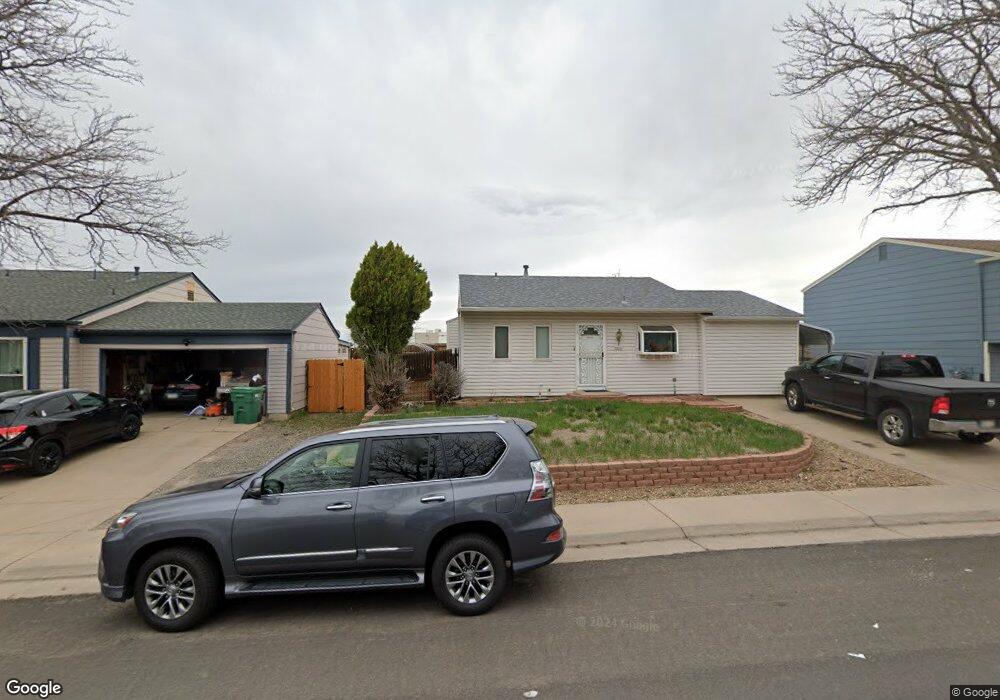
20349 E Coolidge Dr Aurora, CO 80011
Tower Triangle NeighborhoodEstimated Value: $376,386 - $397,000
2
Beds
1
Bath
832
Sq Ft
$463/Sq Ft
Est. Value
About This Home
This home is located at 20349 E Coolidge Dr, Aurora, CO 80011 and is currently estimated at $385,347, approximately $463 per square foot. 20349 E Coolidge Dr is a home located in Adams County with nearby schools including Clyde Miller K-8 and Vista Peak 9-12 Preparatory.
Ownership History
Date
Name
Owned For
Owner Type
Purchase Details
Closed on
Mar 2, 2015
Sold by
Mills Roger
Bought by
Mills Jessica and Mills Lucas
Current Estimated Value
Home Financials for this Owner
Home Financials are based on the most recent Mortgage that was taken out on this home.
Original Mortgage
$29,500
Interest Rate
3.66%
Mortgage Type
Unknown
Purchase Details
Closed on
Sep 14, 2000
Sold by
Mills Scott L
Bought by
Mills Scott L and Mills Kristie L
Home Financials for this Owner
Home Financials are based on the most recent Mortgage that was taken out on this home.
Original Mortgage
$92,025
Interest Rate
7.97%
Mortgage Type
FHA
Purchase Details
Closed on
Nov 4, 1999
Sold by
And Mills Scott L and Mills Kristie L
Bought by
Mills Scott L
Create a Home Valuation Report for This Property
The Home Valuation Report is an in-depth analysis detailing your home's value as well as a comparison with similar homes in the area
Home Values in the Area
Average Home Value in this Area
Purchase History
| Date | Buyer | Sale Price | Title Company |
|---|---|---|---|
| Mills Jessica | -- | None Available | |
| Mills Scott L | -- | -- | |
| Mills Scott L | -- | -- |
Source: Public Records
Mortgage History
| Date | Status | Borrower | Loan Amount |
|---|---|---|---|
| Closed | Mills Jessica | $29,500 | |
| Closed | Mills Scott L | $92,025 |
Source: Public Records
Tax History
| Year | Tax Paid | Tax Assessment Tax Assessment Total Assessment is a certain percentage of the fair market value that is determined by local assessors to be the total taxable value of land and additions on the property. | Land | Improvement |
|---|---|---|---|---|
| 2025 | $2,249 | $23,120 | $5,640 | $17,480 |
| 2024 | $2,249 | $21,250 | $5,190 | $16,060 |
| 2023 | $2,285 | $25,160 | $5,070 | $20,090 |
| 2022 | $2,141 | $18,840 | $5,140 | $13,700 |
| 2021 | $2,230 | $18,840 | $5,140 | $13,700 |
| 2020 | $2,079 | $17,620 | $5,290 | $12,330 |
| 2019 | $2,076 | $17,620 | $5,290 | $12,330 |
| 2018 | $1,539 | $13,010 | $4,680 | $8,330 |
| 2017 | $1,367 | $13,010 | $4,680 | $8,330 |
| 2016 | $917 | $8,650 | $2,390 | $6,260 |
| 2015 | $888 | $8,650 | $2,390 | $6,260 |
| 2014 | $738 | $7,080 | $1,750 | $5,330 |
Source: Public Records
Map
Nearby Homes
- 20561 E Coolidge Place
- 19682 E Batavia Dr
- 19583 E Buchanan Place
- 1635 Ensenada Way
- 1619 Ensenada St
- 2039 Espana Way
- 1956 Cathay St
- 19093 E 22nd Dr
- 1791 Biscay St
- 1770 Bahama St
- 1931 Andes St
- 21885 E 9th Place
- 21862 E 8th Ave
- 719 N Quatar St
- 749 N Quemoy St
- 21761 E 7th Ave
- 746 N Rome St
- 749 N Shawnee St
- 22155 E 7th Place
- 24091 E 30th Ave
- 20359 E Coolidge Dr
- 20339 E Coolidge Dr
- 20501 E Coolidge Place
- 20309 E Coolidge Dr
- 20358 E Coolidge Dr
- 20338 E Coolidge Dr
- 20511 E Coolidge Place
- 20308 E Coolidge Dr
- 20297 E Coolidge Dr
- 20500 E Coolidge Place
- 20296 E Coolidge Dr
- 20457 E Buchanan Dr
- 20497 E Buchanan Dr
- 20521 E Coolidge Place
- 20257 E Coolidge Dr
- 20407 E Buchanan Dr
- 20520 E Coolidge Place
- 20256 E Coolidge Dr
- 20395 E Buchanan Dr
- 20509 E Buchanan Dr
Your Personal Tour Guide
Ask me questions while you tour the home.