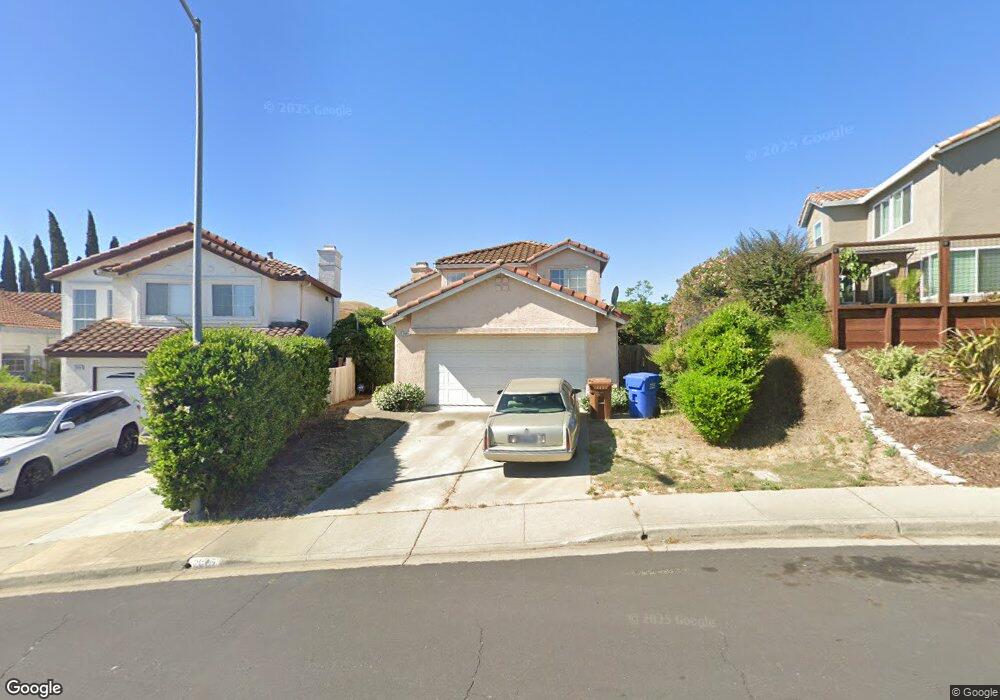
2045 Rapallo Way Bay Point, CA 94565
Estimated Value: $725,000 - $776,000
4
Beds
3
Baths
2,084
Sq Ft
$359/Sq Ft
Est. Value
About This Home
This home is located at 2045 Rapallo Way, Bay Point, CA 94565 and is currently estimated at $747,863, approximately $358 per square foot. 2045 Rapallo Way is a home located in Contra Costa County with nearby schools including Rio Vista Elementary School, Riverview Middle School, and Mt. Diablo High School.
Ownership History
Date
Name
Owned For
Owner Type
Purchase Details
Closed on
Jan 29, 2009
Sold by
Wachovia Mortgage Bank Fsb
Bought by
Jones Mark J
Current Estimated Value
Home Financials for this Owner
Home Financials are based on the most recent Mortgage that was taken out on this home.
Original Mortgage
$339,138
Outstanding Balance
$213,687
Interest Rate
5.04%
Mortgage Type
VA
Estimated Equity
$534,176
Purchase Details
Closed on
Dec 1, 2008
Sold by
Abinanti Paul J and Abinanti Rita S
Bought by
Wachovia Mortgage Fsb
Home Financials for this Owner
Home Financials are based on the most recent Mortgage that was taken out on this home.
Original Mortgage
$339,138
Outstanding Balance
$213,687
Interest Rate
5.04%
Mortgage Type
VA
Estimated Equity
$534,176
Purchase Details
Closed on
Aug 11, 2004
Sold by
Carrasco George R and Carrosco Julie Wolters
Bought by
Abinanti Paul J and Abinanti Rita S
Home Financials for this Owner
Home Financials are based on the most recent Mortgage that was taken out on this home.
Original Mortgage
$332,500
Interest Rate
5.97%
Mortgage Type
Stand Alone First
Create a Home Valuation Report for This Property
The Home Valuation Report is an in-depth analysis detailing your home's value as well as a comparison with similar homes in the area
Home Values in the Area
Average Home Value in this Area
Purchase History
| Date | Buyer | Sale Price | Title Company |
|---|---|---|---|
| Jones Mark J | $332,000 | Fidelity National Title Co | |
| Wachovia Mortgage Fsb | $250,100 | None Available | |
| Abinanti Paul J | $475,000 | North American Title |
Source: Public Records
Mortgage History
| Date | Status | Borrower | Loan Amount |
|---|---|---|---|
| Open | Jones Mark J | $339,138 | |
| Previous Owner | Abinanti Paul J | $332,500 | |
| Closed | Abinanti Paul J | $95,000 |
Source: Public Records
Tax History Compared to Growth
Tax History
| Year | Tax Paid | Tax Assessment Tax Assessment Total Assessment is a certain percentage of the fair market value that is determined by local assessors to be the total taxable value of land and additions on the property. | Land | Improvement |
|---|---|---|---|---|
| 2025 | $5,656 | $427,518 | $38,623 | $388,895 |
| 2024 | $5,555 | $419,136 | $37,866 | $381,270 |
| 2023 | $5,555 | $410,919 | $37,124 | $373,795 |
| 2022 | $5,514 | $402,863 | $36,397 | $366,466 |
| 2021 | $5,393 | $394,965 | $35,684 | $359,281 |
| 2019 | $5,273 | $383,253 | $34,627 | $348,626 |
| 2018 | $5,102 | $375,740 | $33,949 | $341,791 |
| 2017 | $4,953 | $368,374 | $33,284 | $335,090 |
| 2016 | $4,828 | $361,152 | $32,632 | $328,520 |
| 2015 | $4,788 | $355,728 | $32,142 | $323,586 |
| 2014 | $4,601 | $338,000 | $30,541 | $307,459 |
Source: Public Records
Map
Nearby Homes
- 536 Bustos Place
- 349 Waterview Place
- 235 Manuel Ct
- 622 Bounty Dr
- 530 Captains Ct
- 621 Bounty Dr
- 3022 Tampico Dr
- 130 Butte Ct
- 120 Butte Ct
- 380 Pacifica Ave
- 2525 Modena Dr
- 2624 Clarita Dr
- 44 Vallarta Ct
- 3777 Willow Pass Rd Unit 30
- 2419 Sienna Dr
- 2708 Rio Seco Dr
- 2273 Toscana Dr
- 211 Riverside Place
- The Bianco Plan at San Marco - Capri
- The Ellero Plan at San Marco - Capri
- 2049 Rapallo Way
- 2025 Rapallo Way
- 2019 Rapallo Way
- 2053 Rapallo Way
- 2015 Rapallo Way
- 1014 Saint Raphael Dr
- 1018 Saint Raphael Dr
- 1022 Saint Raphael Dr
- 1006 Saint Raphael Dr
- 2011 Rapallo Way
- 2057 Rapallo Way
- 1026 Saint Raphael Dr
- 2044 Rapallo Way
- 2007 Rapallo Way
- 2054 Rapallo Way
- 2040 Rapallo Way
- 1030 Saint Raphael Dr
- 2061 Rapallo Way
- 2036 Rapallo Way
- 2032 Rapallo Way