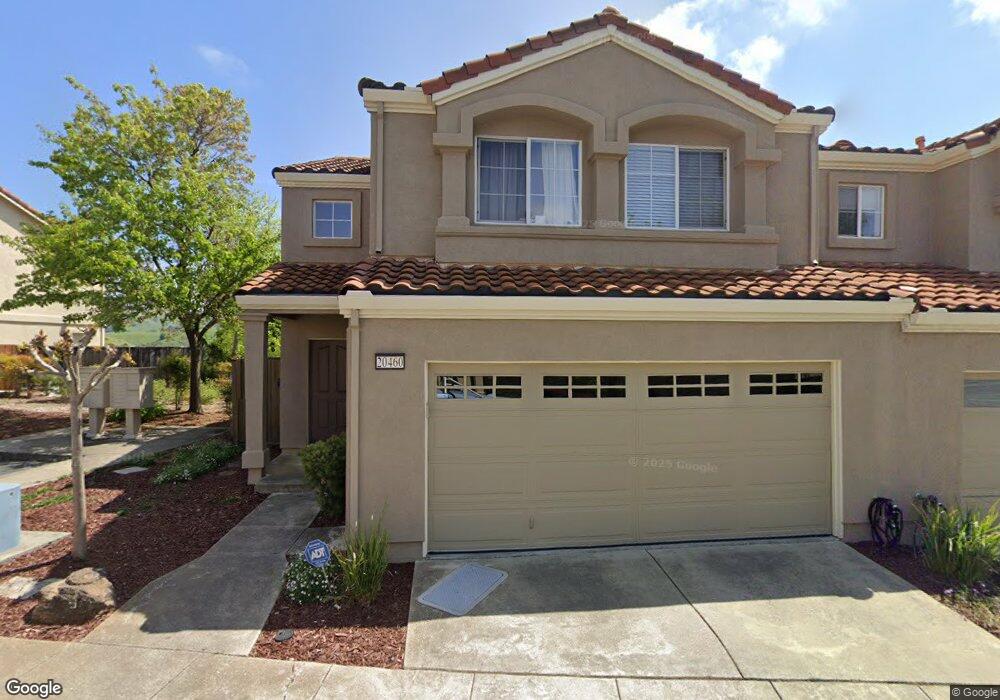
20460 Summercrest Dr Castro Valley, CA 94552
Palomares Hills NeighborhoodEstimated Value: $952,999 - $1,155,000
3
Beds
3
Baths
1,435
Sq Ft
$737/Sq Ft
Est. Value
About This Home
This home is located at 20460 Summercrest Dr, Castro Valley, CA 94552 and is currently estimated at $1,058,000, approximately $737 per square foot. 20460 Summercrest Dr is a home located in Alameda County with nearby schools including Jensen Ranch Elementary School, Creekside Middle School, and Canyon Middle School.
Ownership History
Date
Name
Owned For
Owner Type
Purchase Details
Closed on
Mar 13, 2013
Sold by
Hill Alan R
Bought by
Ho Joh Sungyeon and Ho Kim Jin
Current Estimated Value
Home Financials for this Owner
Home Financials are based on the most recent Mortgage that was taken out on this home.
Original Mortgage
$350,000
Outstanding Balance
$246,425
Interest Rate
3.49%
Mortgage Type
New Conventional
Estimated Equity
$811,575
Purchase Details
Closed on
Sep 12, 2011
Sold by
Forbes Joy B and Emerick Linda F
Bought by
Hill Alan R
Purchase Details
Closed on
Jan 20, 1998
Sold by
Shapell Industries Inc
Bought by
Forbes Joy B and Emerick Linda F
Home Financials for this Owner
Home Financials are based on the most recent Mortgage that was taken out on this home.
Original Mortgage
$192,700
Interest Rate
7.13%
Create a Home Valuation Report for This Property
The Home Valuation Report is an in-depth analysis detailing your home's value as well as a comparison with similar homes in the area
Home Values in the Area
Average Home Value in this Area
Purchase History
| Date | Buyer | Sale Price | Title Company |
|---|---|---|---|
| Ho Joh Sungyeon | $560,000 | Fidelity National Title Co | |
| Hill Alan R | $436,000 | Chicago Title Company | |
| Forbes Joy B | $241,000 | Chicago Title Co |
Source: Public Records
Mortgage History
| Date | Status | Borrower | Loan Amount |
|---|---|---|---|
| Open | Ho Joh Sungyeon | $350,000 | |
| Previous Owner | Forbes Joy B | $192,700 | |
| Closed | Forbes Joy B | $24,050 |
Source: Public Records
Tax History Compared to Growth
Tax History
| Year | Tax Paid | Tax Assessment Tax Assessment Total Assessment is a certain percentage of the fair market value that is determined by local assessors to be the total taxable value of land and additions on the property. | Land | Improvement |
|---|---|---|---|---|
| 2025 | $8,723 | $682,571 | $206,871 | $482,700 |
| 2024 | $8,723 | $669,054 | $202,816 | $473,238 |
| 2023 | $8,580 | $662,798 | $198,839 | $463,959 |
| 2022 | $8,413 | $642,807 | $194,942 | $454,865 |
| 2021 | $8,197 | $630,067 | $191,120 | $445,947 |
| 2020 | $8,009 | $630,537 | $189,161 | $441,376 |
| 2019 | $8,155 | $618,177 | $185,453 | $432,724 |
| 2018 | $7,923 | $606,060 | $181,818 | $424,242 |
| 2017 | $7,714 | $594,176 | $178,253 | $415,923 |
| 2016 | $7,340 | $582,528 | $174,758 | $407,770 |
| 2015 | $6,860 | $573,781 | $172,134 | $401,647 |
| 2014 | $6,778 | $562,541 | $168,762 | $393,779 |
Source: Public Records
Map
Nearby Homes
- 20377 Summerglen Place
- 22284 E Lyndon Loop
- 20340 Hunters Knolls
- 5665 Shadow Ridge Dr
- 6066 Monte Verde Ct
- 0 Greenridge Ct
- 5605 Greenridge Rd
- 5513 Rothman Ct
- 5529 Feather Ct
- 5288 Crown Ct
- 5389 San Simeon Place
- 18698 Cull Canyon Rd
- 17716 Columbia Dr
- 4937 Crow Canyon Rd
- 18081 Columbia Dr
- 21798 Independent School Rd
- 131 Wittenham Ct
- 4597 Edwards Ln
- 5158 Crane Ave
- 3594 Cama Ln
- 20488 Summercrest Dr
- 20520 Summercrest Dr
- 20428 Summercrest Dr
- 20548 Summercrest Dr
- 20481 Summercrest Dr
- 20400 Summercrest Dr
- 20453 Summercrest Dr
- 20423 Summercrest Dr
- 20368 Summercrest Dr
- 20524 Summerglen Place
- 20395 Summercrest Dr
- 20496 Summerglen Place
- 20580 Summercrest Dr
- 20365 Summercrest Dr
- 20340 Summercrest Dr
- 20468 Summerglen Place
- 20423 Summerpark Place
- 20337 Summercrest Dr
- 20608 Summercrest Dr
- 20438 Summerglen Place