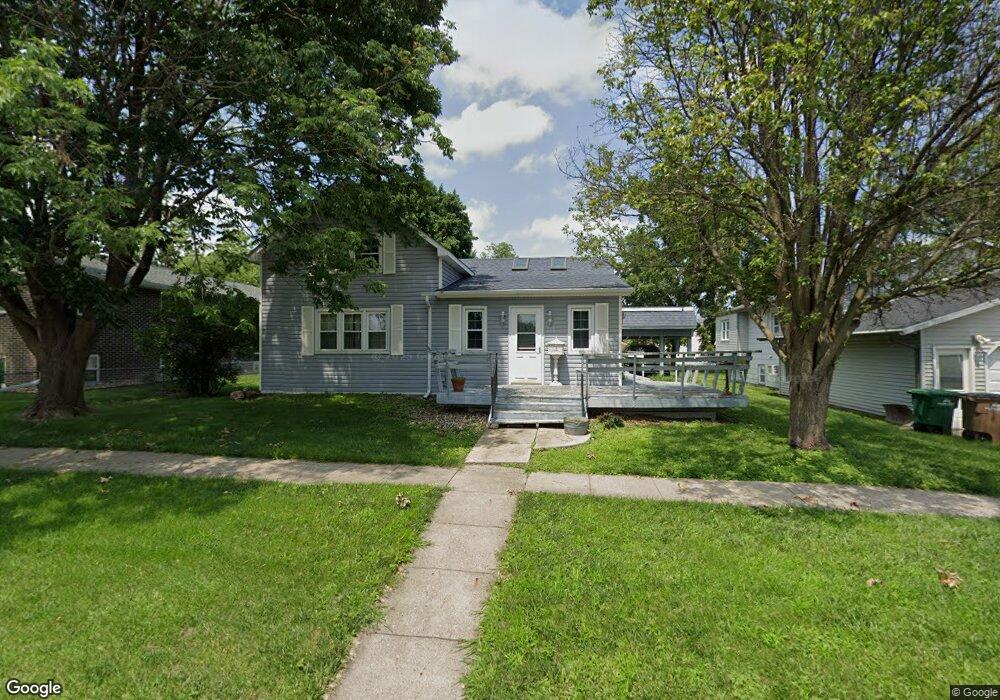
205 3rd St SE Altoona, IA 50009
Estimated Value: $181,000 - $249,000
2
Beds
1
Bath
1,393
Sq Ft
$160/Sq Ft
Est. Value
About This Home
This home is located at 205 3rd St SE, Altoona, IA 50009 and is currently estimated at $223,159, approximately $160 per square foot. 205 3rd St SE is a home located in Polk County with nearby schools including Centennial Elementary School, Southeast Polk Spring Creek- 6th Grade, and Southeast Polk Junior High School.
Ownership History
Date
Name
Owned For
Owner Type
Purchase Details
Closed on
May 22, 2017
Sold by
Lamb Lew W
Bought by
Lamb Jeff and Nicholson Sonya M
Current Estimated Value
Home Financials for this Owner
Home Financials are based on the most recent Mortgage that was taken out on this home.
Original Mortgage
$97,000
Outstanding Balance
$80,667
Interest Rate
4.1%
Mortgage Type
New Conventional
Estimated Equity
$142,492
Purchase Details
Closed on
Mar 10, 2017
Sold by
Lamb Lew W
Bought by
Lamb Lew W
Create a Home Valuation Report for This Property
The Home Valuation Report is an in-depth analysis detailing your home's value as well as a comparison with similar homes in the area
Home Values in the Area
Average Home Value in this Area
Purchase History
| Date | Buyer | Sale Price | Title Company |
|---|---|---|---|
| Lamb Jeff | $100,000 | None Available | |
| Lamb Lew W | -- | None Available | |
| Lamb Lew W | -- | None Available |
Source: Public Records
Mortgage History
| Date | Status | Borrower | Loan Amount |
|---|---|---|---|
| Open | Lamb Jeff | $97,000 |
Source: Public Records
Tax History Compared to Growth
Tax History
| Year | Tax Paid | Tax Assessment Tax Assessment Total Assessment is a certain percentage of the fair market value that is determined by local assessors to be the total taxable value of land and additions on the property. | Land | Improvement |
|---|---|---|---|---|
| 2025 | $3,190 | $210,000 | $48,100 | $161,900 |
| 2024 | $3,190 | $185,200 | $42,200 | $143,000 |
| 2023 | $3,042 | $185,200 | $42,200 | $143,000 |
| 2022 | $3,004 | $149,100 | $35,700 | $113,400 |
| 2021 | $2,838 | $149,100 | $35,700 | $113,400 |
| 2020 | $2,792 | $134,000 | $32,200 | $101,800 |
| 2019 | $2,508 | $134,000 | $32,200 | $101,800 |
| 2018 | $2,512 | $118,200 | $28,300 | $89,900 |
| 2017 | $2,316 | $118,200 | $28,300 | $89,900 |
| 2016 | $2,304 | $110,500 | $26,100 | $84,400 |
| 2015 | $2,304 | $110,500 | $26,100 | $84,400 |
| 2014 | $2,142 | $102,900 | $24,200 | $78,700 |
Source: Public Records
Map
Nearby Homes
- 400 4th St SE
- 301 5th Street Place SE
- 505 5th St SE
- 603 1st Ave S
- 605 1st Ave S
- 506 2nd Ave SW
- 101 8th Ave SE
- 136 8th NE
- 128 8th NE
- 120 8th NE
- 708 2nd Ave SW
- 109 8th NE
- 136 8th Ave SE
- 109 8th Ave SE
- 128 8th Ave SE
- 120 8th Ave SE
- Lincoln Plan at Edgewood Trail
- Fairfield Plan at Edgewood Trail
- Madison Plan at Edgewood Trail
- Holland Plan at Edgewood Trail