Estimated Value: $332,865 - $405,000
3
Beds
3
Baths
2,453
Sq Ft
$146/Sq Ft
Est. Value
About This Home
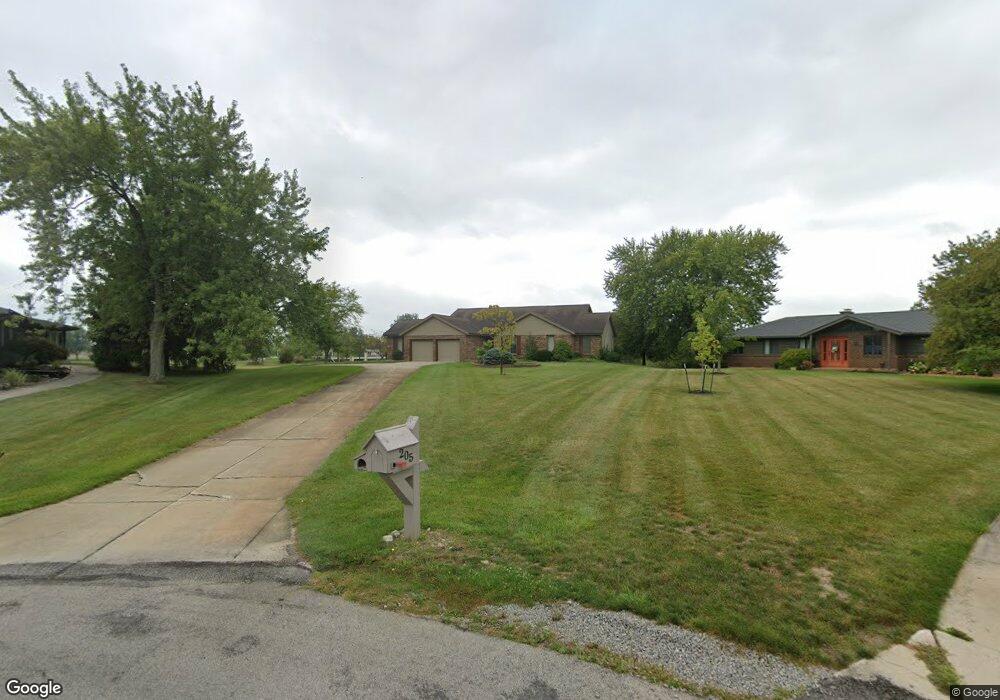
This home is located at 205 Belfast Ln, Bryan, OH 43506 and is currently estimated at $357,216, approximately $145 per square foot. 205 Belfast Ln is a home located in Williams County with nearby schools including Bryan Elementary PK-5, Washington Elementary School, and Bryan Middle School/High School.
Ownership History
Date
Name
Owned For
Owner Type
Purchase Details
Closed on
Oct 2, 2020
Sold by
Nash David R and Nash Vicki A
Bought by
Nash David R and Nash Vicki A
Current Estimated Value
Home Financials for this Owner
Home Financials are based on the most recent Mortgage that was taken out on this home.
Original Mortgage
$472,500
Outstanding Balance
$464,277
Interest Rate
2.87%
Mortgage Type
Reverse Mortgage Home Equity Conversion Mortgage
Estimated Equity
-$107,061
Purchase Details
Closed on
Apr 24, 2006
Sold by
Pepple Loella J
Bought by
Nash David R and Nash Vicki A
Home Financials for this Owner
Home Financials are based on the most recent Mortgage that was taken out on this home.
Original Mortgage
$242,400
Interest Rate
6.39%
Mortgage Type
New Conventional
Purchase Details
Closed on
Oct 13, 1998
Sold by
Pepple Loella J
Bought by
Pepple Loella J Trustee
Purchase Details
Closed on
Jan 1, 1990
Bought by
Pepple Loella J
Create a Home Valuation Report for This Property
The Home Valuation Report is an in-depth analysis detailing your home's value as well as a comparison with similar homes in the area
Purchase History
| Date | Buyer | Sale Price | Title Company |
|---|---|---|---|
| Nash David R | -- | Fnc Title Services Llc | |
| Nash David R | $303,000 | None Available | |
| Pepple Loella J Trustee | -- | -- | |
| Pepple Loella J | -- | -- |
Source: Public Records
Mortgage History
| Date | Status | Borrower | Loan Amount |
|---|---|---|---|
| Open | Nash David R | $472,500 | |
| Closed | Nash David R | $242,400 |
Source: Public Records
Tax History
| Year | Tax Paid | Tax Assessment Tax Assessment Total Assessment is a certain percentage of the fair market value that is determined by local assessors to be the total taxable value of land and additions on the property. | Land | Improvement |
|---|---|---|---|---|
| 2025 | $3,559 | $90,060 | $15,330 | $74,730 |
| 2024 | $3,559 | $90,060 | $15,330 | $74,730 |
| 2023 | $3,637 | $79,460 | $19,360 | $60,100 |
| 2022 | $3,534 | $79,460 | $19,360 | $60,100 |
| 2021 | $3,552 | $79,460 | $19,360 | $60,100 |
| 2020 | $3,496 | $67,350 | $16,420 | $50,930 |
| 2019 | $3,472 | $67,350 | $16,420 | $50,930 |
| 2018 | $3,576 | $67,350 | $16,420 | $50,930 |
| 2017 | $3,882 | $75,750 | $16,420 | $59,330 |
| 2016 | $3,676 | $75,750 | $16,420 | $59,330 |
| 2015 | $3,830 | $75,750 | $16,420 | $59,330 |
| 2014 | $3,830 | $75,750 | $16,420 | $59,330 |
| 2013 | $3,844 | $75,750 | $16,420 | $59,330 |
Source: Public Records
Map
Nearby Homes
- 202 Belfast Ln
- 324 Dublin Ln
- 00 Troon Ct
- 125 Turnberry Dr
- 0 Saint Andrews Dr
- 101 Westview St
- 12107 Williams County C
- 12341 County Road C
- 5966 County Road 12
- 1319 Ohio Dr
- 418 Connin St
- 903 Greystone Dr
- 320 Newdale Dr
- 1001 Greystone Dr
- 901 Stonehedge Dr
- 8741 State Route 34
- 916 Navarre Ave
- 630 Center Ridge Rd
- 1156 State Route 2
- 13673 County Rd E Unit 10
- 203 Belfast Ln
- 204 Belfast Ln
- 201 Belfast Ln
- 119 Country Club Rd
- 318 Dublin Ln
- 316 Dublin Ln
- 310 Orchard Hills Dr
- 320 Dublin Ln
- 125 Country Club Rd
- 314 Dublin Ln
- 0 Dublin Ln
- 305 Orchard Hills Dr
- 000 Orchard Hills Dr
- 01 Orchard Hills Dr
- 116 Country Club Rd
- 307 Orchard Hills Dr
- 114 Country Club Rd
- 127 Country Club Rd
- 309 Orchard Hills Dr
- 126 Country Club Rd
Your Personal Tour Guide
Ask me questions while you tour the home.