Estimated Value: $315,000 - $427,000
3
Beds
2
Baths
1,008
Sq Ft
$376/Sq Ft
Est. Value
About This Home
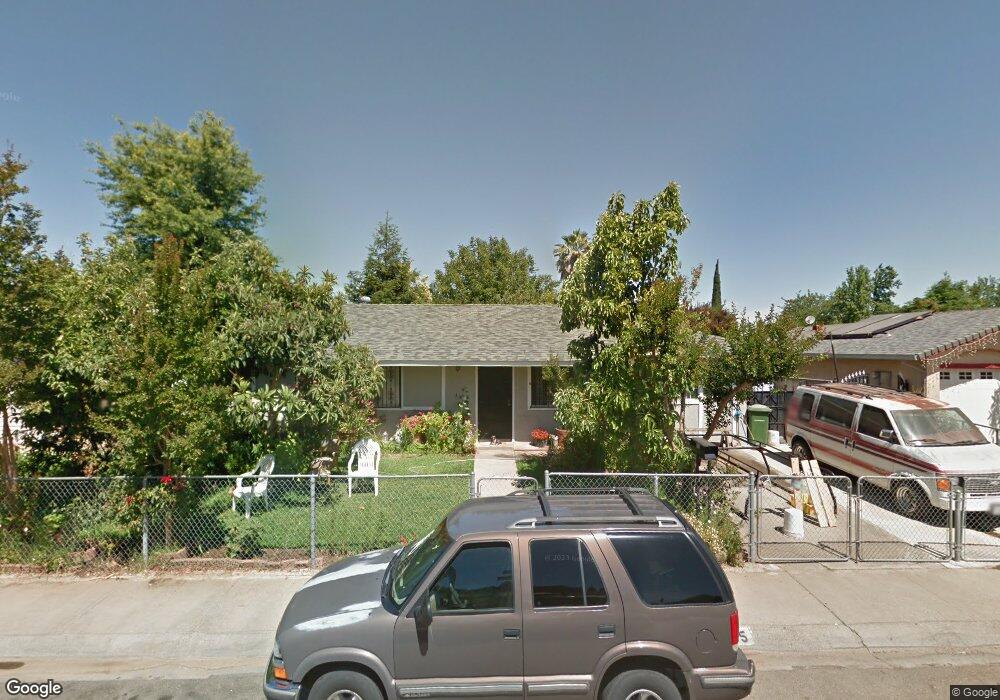
This home is located at 205 Cindy Ln, Galt, CA 95632 and is currently estimated at $379,342, approximately $376 per square foot. 205 Cindy Ln is a home located in Sacramento County with nearby schools including Valley Oaks Elementary School, Robert L. McCaffrey Middle School, and Galt High School.
Ownership History
Date
Name
Owned For
Owner Type
Purchase Details
Closed on
Aug 7, 2024
Sold by
Montanez Alfredo
Bought by
Montanez Maribel
Current Estimated Value
Home Financials for this Owner
Home Financials are based on the most recent Mortgage that was taken out on this home.
Original Mortgage
$368,600
Outstanding Balance
$364,087
Interest Rate
6.86%
Mortgage Type
New Conventional
Estimated Equity
$15,255
Purchase Details
Closed on
Mar 15, 2012
Sold by
Montanez Alfredo and Montanez Beatriz
Bought by
Montanez Alfredo
Create a Home Valuation Report for This Property
The Home Valuation Report is an in-depth analysis detailing your home's value as well as a comparison with similar homes in the area
Home Values in the Area
Average Home Value in this Area
Purchase History
| Date | Buyer | Sale Price | Title Company |
|---|---|---|---|
| Montanez Maribel | $380,000 | Old Republic Title Company | |
| Montanez Alfredo | -- | Old Republic Title Company | |
| Montanez Alfredo | -- | None Available |
Source: Public Records
Mortgage History
| Date | Status | Borrower | Loan Amount |
|---|---|---|---|
| Open | Montanez Alfredo | $368,600 |
Source: Public Records
Tax History
| Year | Tax Paid | Tax Assessment Tax Assessment Total Assessment is a certain percentage of the fair market value that is determined by local assessors to be the total taxable value of land and additions on the property. | Land | Improvement |
|---|---|---|---|---|
| 2025 | $940 | $380,000 | $100,000 | $280,000 |
| 2024 | $940 | $90,766 | $27,713 | $63,053 |
| 2023 | $923 | $88,987 | $27,170 | $61,817 |
| 2022 | $884 | $87,243 | $26,638 | $60,605 |
| 2021 | $884 | $85,533 | $26,116 | $59,417 |
| 2020 | $876 | $84,657 | $25,849 | $58,808 |
| 2019 | $852 | $82,998 | $25,343 | $57,655 |
| 2018 | $849 | $81,372 | $24,847 | $56,525 |
| 2017 | $815 | $79,777 | $24,360 | $55,417 |
| 2016 | $781 | $78,214 | $23,883 | $54,331 |
| 2015 | $753 | $77,040 | $23,525 | $53,515 |
| 2014 | $750 | $75,532 | $23,065 | $52,467 |
Source: Public Records
Map
Nearby Homes
Your Personal Tour Guide
Ask me questions while you tour the home.