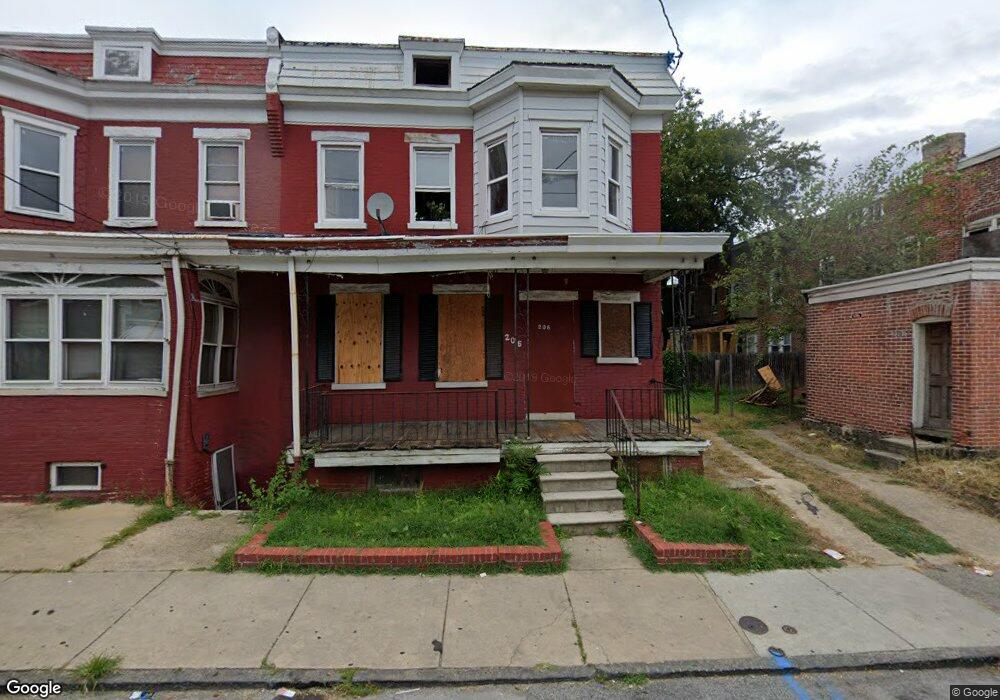
205 E 23rd St Wilmington, DE 19802
Vandever Avenue NeighborhoodEstimated Value: $178,000 - $192,620
4
Beds
1
Bath
1,750
Sq Ft
$106/Sq Ft
Est. Value
About This Home
This home is located at 205 E 23rd St, Wilmington, DE 19802 and is currently estimated at $185,405, approximately $105 per square foot. 205 E 23rd St is a home located in New Castle County with nearby schools including Lombardy Elementary School, Springer Middle School, and Brandywine High School.
Ownership History
Date
Name
Owned For
Owner Type
Purchase Details
Closed on
Feb 12, 2019
Sold by
Nova Mentis Corp
Bought by
Wilmington Neighborhood Conservancy Land
Current Estimated Value
Purchase Details
Closed on
Feb 12, 2016
Sold by
Kaja Holdings 2 Llc
Bought by
Nova Mentis Corporation
Purchase Details
Closed on
Aug 4, 2014
Sold by
Jpmorgan Chase Bank Na
Bought by
Kaja Holdings 2 Llc
Purchase Details
Closed on
Mar 16, 2013
Sold by
Wilkes Rosetta
Bought by
Jpmorgan Chase Bank Na
Create a Home Valuation Report for This Property
The Home Valuation Report is an in-depth analysis detailing your home's value as well as a comparison with similar homes in the area
Home Values in the Area
Average Home Value in this Area
Purchase History
| Date | Buyer | Sale Price | Title Company |
|---|---|---|---|
| Wilmington Neighborhood Conservancy Land | $9,551 | None Available | |
| Nova Mentis Corporation | $9,500 | Attorney | |
| Kaja Holdings 2 Llc | $3,727 | None Available | |
| Jpmorgan Chase Bank Na | $34,150 | None Available |
Source: Public Records
Tax History
| Year | Tax Paid | Tax Assessment Tax Assessment Total Assessment is a certain percentage of the fair market value that is determined by local assessors to be the total taxable value of land and additions on the property. | Land | Improvement |
|---|---|---|---|---|
| 2024 | -- | $20,800 | $2,200 | $18,600 |
| 2023 | -- | $20,800 | $2,200 | $18,600 |
| 2022 | $0 | $20,800 | $2,200 | $18,600 |
| 2021 | $1,012 | $20,800 | $2,200 | $18,600 |
| 2020 | $1,012 | $20,800 | $2,200 | $18,600 |
| 2019 | $1,012 | $20,800 | $2,200 | $18,600 |
| 2018 | $427 | $20,800 | $2,200 | $18,600 |
| 2017 | $978 | $20,800 | $2,200 | $18,600 |
| 2016 | $978 | $20,800 | $2,200 | $18,600 |
| 2015 | $923 | $20,800 | $2,200 | $18,600 |
| 2014 | $923 | $20,800 | $2,200 | $18,600 |
Source: Public Records
Map
Nearby Homes
- 2313 Carter St
- 2401 Carter St
- 31 E 23rd St
- 2305 Jessup St
- 2230 Lamotte St
- 209 E 25th St
- 19 E 25th St
- 2 E 24th St
- 308 E 23rd St
- 2318 N Market St
- 2314 N Market St
- 217 E 22nd St
- 2300 N Market St
- 2203 N Pine St
- 606 E 22nd St
- 2321 N Tatnall St
- 101 W 23rd St
- 2705 Speakman Place
- 118 W 26th St
- 724 E 22nd St
Your Personal Tour Guide
Ask me questions while you tour the home.