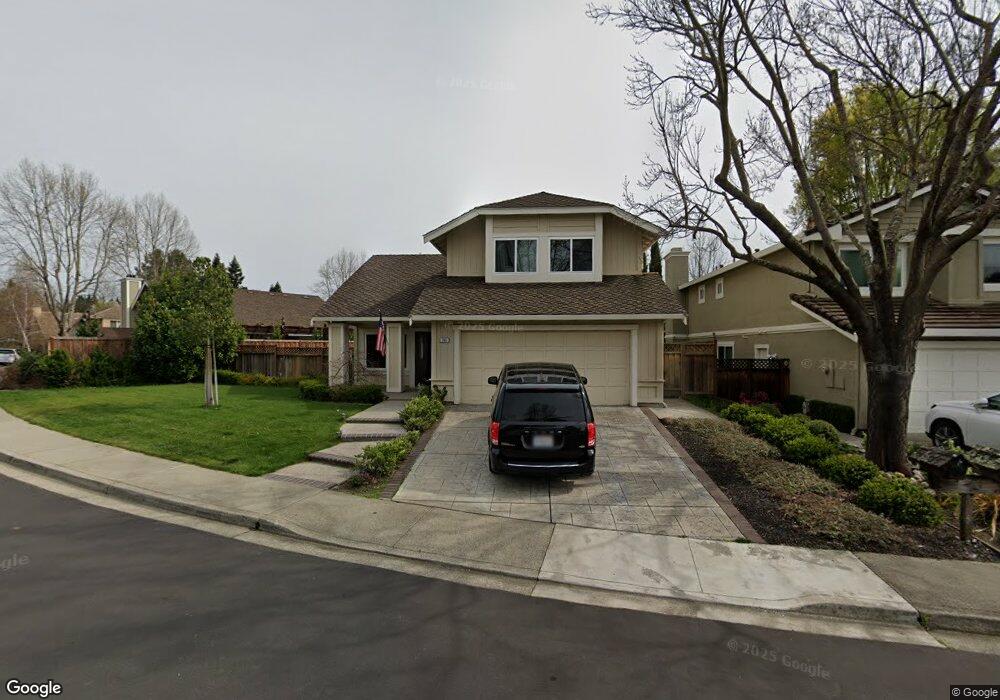
205 Monte Carlo Way Danville, CA 94506
Sycamore Valley NeighborhoodEstimated Value: $1,708,000 - $1,865,000
4
Beds
3
Baths
2,183
Sq Ft
$824/Sq Ft
Est. Value
About This Home
This home is located at 205 Monte Carlo Way, Danville, CA 94506 and is currently estimated at $1,798,102, approximately $823 per square foot. 205 Monte Carlo Way is a home located in Contra Costa County with nearby schools including Sycamore Valley Elementary School, Charlotte Wood Middle School, and San Ramon Valley High School.
Ownership History
Date
Name
Owned For
Owner Type
Purchase Details
Closed on
Dec 20, 2010
Sold by
Rathnayake Rathnayake M D and Rathnayake Asoka I
Bought by
Gurovith Arie and Gurovith Yelena
Current Estimated Value
Home Financials for this Owner
Home Financials are based on the most recent Mortgage that was taken out on this home.
Original Mortgage
$637,421
Outstanding Balance
$420,059
Interest Rate
4.17%
Mortgage Type
FHA
Estimated Equity
$1,378,043
Create a Home Valuation Report for This Property
The Home Valuation Report is an in-depth analysis detailing your home's value as well as a comparison with similar homes in the area
Home Values in the Area
Average Home Value in this Area
Purchase History
| Date | Buyer | Sale Price | Title Company |
|---|---|---|---|
| Gurovith Arie | $654,000 | Old Republic Title Company |
Source: Public Records
Mortgage History
| Date | Status | Borrower | Loan Amount |
|---|---|---|---|
| Open | Gurovith Arie | $637,421 |
Source: Public Records
Tax History Compared to Growth
Tax History
| Year | Tax Paid | Tax Assessment Tax Assessment Total Assessment is a certain percentage of the fair market value that is determined by local assessors to be the total taxable value of land and additions on the property. | Land | Improvement |
|---|---|---|---|---|
| 2025 | $10,122 | $837,875 | $512,465 | $325,410 |
| 2024 | $9,966 | $821,447 | $502,417 | $319,030 |
| 2023 | $9,966 | $805,341 | $492,566 | $312,775 |
| 2022 | $9,894 | $789,551 | $482,908 | $306,643 |
| 2021 | $9,685 | $774,071 | $473,440 | $300,631 |
| 2019 | $9,480 | $751,114 | $459,399 | $291,715 |
| 2018 | $9,137 | $736,388 | $450,392 | $285,996 |
| 2017 | $8,812 | $721,950 | $441,561 | $280,389 |
| 2016 | $8,701 | $707,795 | $432,903 | $274,892 |
| 2015 | $8,590 | $697,164 | $426,401 | $270,763 |
| 2014 | $8,474 | $683,509 | $418,049 | $265,460 |
Source: Public Records
Map
Nearby Homes
- 134 Tivoli Ln
- 3652 Old Blackhawk Rd
- 226 Promenade Ln
- 422 Sutton Cir
- 105 Creighton Way
- 24 Timberview Ct
- 132 Victoria Place
- 6401 Camino Tassajara
- 314 W Meadows Ln
- 89 Amberfield Ln
- 140 Blackstone Dr
- 3466 Silver Maple Dr
- 32 Maximo Ct
- 313 Camino Arroyo E
- 2120 Goldenrod Ln
- 3846 Sheffield Cir
- 100 Bedford Ct
- 16 Haskins Ranch Cir
- 404 Regal Lily Ln
- 1000 Sunshine Cir
- 209 Monte Carlo Way
- 191 Monte Carlo Way
- 189 Monte Carlo Way
- 211 Monte Carlo Way
- 320 Fontaine Dr
- 187 Monte Carlo Way
- 213 Monte Carlo Way
- 206 Monte Carlo Way
- 322 Fontaine Dr
- 208 Monte Carlo Way
- 204 Monte Carlo Way
- 202 Monte Carlo Way
- 210 Monte Carlo Way
- 200 Monte Carlo Way
- 185 Monte Carlo Way
- 212 Monte Carlo Way
- 324 Fontaine Dr
- 198 Monte Carlo Way
- 214 Monte Carlo Way
- 192 Monte Carlo Way