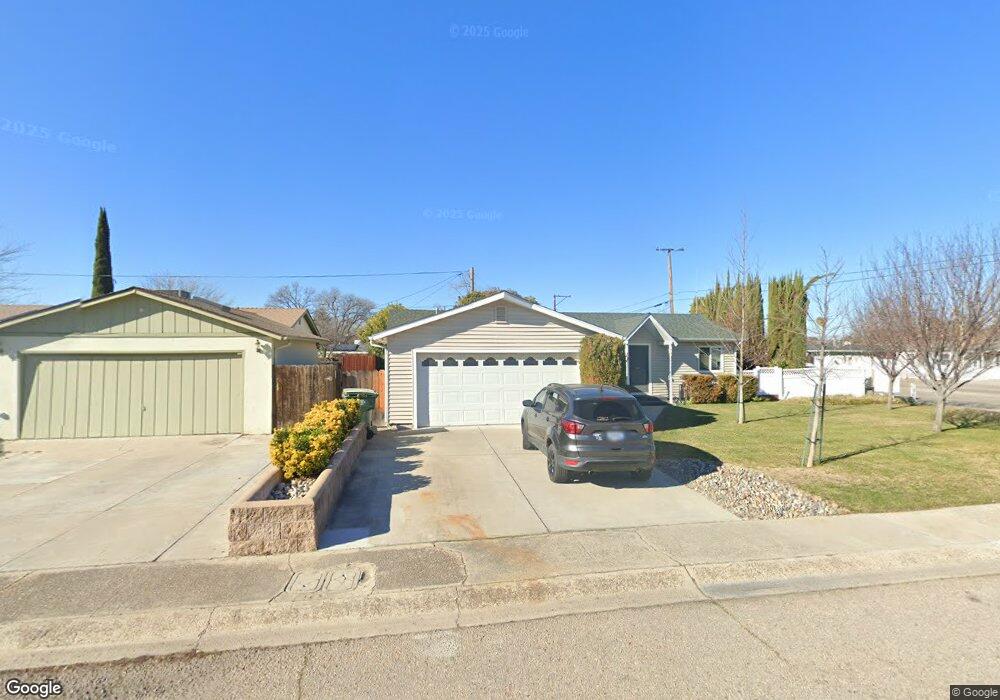
205 San Fernando Dr Paso Robles, CA 93446
Estimated Value: $487,195 - $546,000
3
Beds
2
Baths
1,170
Sq Ft
$444/Sq Ft
Est. Value
About This Home
This home is located at 205 San Fernando Dr, Paso Robles, CA 93446 and is currently estimated at $519,549, approximately $444 per square foot. 205 San Fernando Dr is a home located in San Luis Obispo County with nearby schools including Virginia Peterson Elementary School, Daniel Lewis Middle School, and Paso Robles High School.
Ownership History
Date
Name
Owned For
Owner Type
Purchase Details
Closed on
Dec 4, 2000
Sold by
Jean Bryant Jacqueline and Jacqueline Jean Bryant Trust
Bought by
Ritter Anthony L and Ritter Kimberly M
Current Estimated Value
Purchase Details
Closed on
Jan 30, 1998
Sold by
Bryant Jacqueline Jean
Bought by
Bryant Jacqueline Jean and The Jacqueline Jean Bryant Tru
Purchase Details
Closed on
Jan 28, 1998
Sold by
Bryant Jacqueline Jean
Bought by
Bryant Jacqueline Jean and The Jacqueline Jean Bryant Tru
Purchase Details
Closed on
Dec 14, 1993
Sold by
Bryant Bobbie Ray
Bought by
Bryant Jacqueline J
Home Financials for this Owner
Home Financials are based on the most recent Mortgage that was taken out on this home.
Original Mortgage
$40,000
Interest Rate
7.09%
Create a Home Valuation Report for This Property
The Home Valuation Report is an in-depth analysis detailing your home's value as well as a comparison with similar homes in the area
Home Values in the Area
Average Home Value in this Area
Purchase History
| Date | Buyer | Sale Price | Title Company |
|---|---|---|---|
| Ritter Anthony L | $150,000 | Cuesta Title | |
| Bryant Jacqueline Jean | -- | -- | |
| Bryant Jacqueline Jean | -- | -- | |
| Bryant Jacqueline Jean | -- | -- | |
| Bryant Jacqueline Jean | -- | -- | |
| Bryant Jacqueline Jean | -- | -- | |
| Bryant Jacqueline Jean | -- | -- | |
| Bryant Jacqueline J | -- | Homestead Title Corp |
Source: Public Records
Mortgage History
| Date | Status | Borrower | Loan Amount |
|---|---|---|---|
| Previous Owner | Bryant Jacqueline J | $40,000 |
Source: Public Records
Tax History Compared to Growth
Tax History
| Year | Tax Paid | Tax Assessment Tax Assessment Total Assessment is a certain percentage of the fair market value that is determined by local assessors to be the total taxable value of land and additions on the property. | Land | Improvement |
|---|---|---|---|---|
| 2025 | $710 | $72,281 | $11,186 | $61,095 |
| 2024 | $697 | $70,865 | $10,967 | $59,898 |
| 2023 | $697 | $69,476 | $10,752 | $58,724 |
| 2022 | $685 | $68,115 | $10,542 | $57,573 |
| 2021 | $672 | $66,781 | $10,336 | $56,445 |
| 2020 | $662 | $66,098 | $10,231 | $55,867 |
| 2019 | $651 | $64,803 | $10,031 | $54,772 |
| 2018 | $641 | $63,534 | $9,835 | $53,699 |
| 2017 | $601 | $62,290 | $9,643 | $52,647 |
| 2016 | $588 | $61,069 | $9,454 | $51,615 |
| 2015 | $584 | $60,152 | $9,312 | $50,840 |
| 2014 | $562 | $58,975 | $9,130 | $49,845 |
Source: Public Records
Map
Nearby Homes
- 17 Green Ct
- 326 Partridge Ave
- 128 Flag Way Unit A
- 230 Partridge Ave
- 225 Lark Dr
- 1320 Teal Ave
- 1337 Stoney Creek Rd
- 1128 Golf Place
- 210 Partridge Ave
- 1951 Tulipwood Dr
- 301 Oak Meadow Ln
- 204 Nighthawk Dr
- 315 Oak Meadow Ln
- 331 Wild Mustard Ln
- 909 Palm Desert Ct
- Liberty II Plan at Nevina - Freedom 50
- Pinnacle Plan at Nevina - Freedom 60
- Reunion II Plan at Nevina - Freedom 40
- Excite II Plan at Nevina - Freedom 50
- Meridian Plan at Nevina - Freedom 60
- 215 San Fernando Dr
- 225 San Fernando Dr
- 214 San Augustin Dr
- 204 Santa Ysabel Ave
- 0 Santa Ysabel Rd Unit PR144294
- 212 San Fernando Dr
- 234 Santa Ysabel Ave
- 235 San Fernando Dr
- 220 San Fernando Dr
- 234 San Augustin Dr
- 225 Santa Ysabel Ave
- 228 San Fernando Dr
- 215 Santa Ysabel Ave
- 235 Santa Ysabel Ave
- 244 Santa Ysabel Ave
- 245 San Fernando Dr
- 236 San Fernando Dr
- 215 San Augustin Dr
- 245 Santa Ysabel Ave