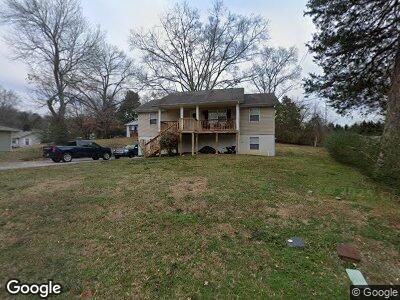
205 Signal View St Chattanooga, TN 37415
Estimated Value: $292,000 - $382,000
3
Beds
3
Baths
1,490
Sq Ft
$214/Sq Ft
Est. Value
About This Home
This home is located at 205 Signal View St, Chattanooga, TN 37415 and is currently estimated at $319,009, approximately $214 per square foot. 205 Signal View St is a home located in Hamilton County with nearby schools including Red Bank Elementary School, Red Bank Middle School, and Red Bank High School.
Ownership History
Date
Name
Owned For
Owner Type
Purchase Details
Closed on
Aug 27, 2002
Sold by
Evon Terri L
Bought by
Harper Jonathan D and Harper Kellie J
Current Estimated Value
Home Financials for this Owner
Home Financials are based on the most recent Mortgage that was taken out on this home.
Original Mortgage
$87,600
Outstanding Balance
$35,555
Interest Rate
5%
Mortgage Type
Purchase Money Mortgage
Estimated Equity
$266,783
Purchase Details
Closed on
Feb 18, 2000
Sold by
Smith L P
Bought by
Evon Terri L
Home Financials for this Owner
Home Financials are based on the most recent Mortgage that was taken out on this home.
Original Mortgage
$71,200
Interest Rate
7.62%
Mortgage Type
Purchase Money Mortgage
Purchase Details
Closed on
May 26, 1999
Sold by
William Harcrow
Bought by
Smith L P
Purchase Details
Closed on
Aug 19, 1998
Sold by
Daniel Christopher Mary J and Daniel Christopher
Bought by
Harcrow William Thomas
Purchase Details
Closed on
Mar 7, 1995
Sold by
William Harcrow
Bought by
Christopher Mary Jo
Create a Home Valuation Report for This Property
The Home Valuation Report is an in-depth analysis detailing your home's value as well as a comparison with similar homes in the area
Home Values in the Area
Average Home Value in this Area
Purchase History
| Date | Buyer | Sale Price | Title Company |
|---|---|---|---|
| Harper Jonathan D | $109,500 | Legal Title & Escrow Inc | |
| Evon Terri L | $89,000 | -- | |
| Smith L P | $6,000 | -- | |
| Harcrow William Thomas | -- | -- | |
| Christopher Mary Jo | -- | -- |
Source: Public Records
Mortgage History
| Date | Status | Borrower | Loan Amount |
|---|---|---|---|
| Open | Harper Jonathan D | $87,600 | |
| Previous Owner | Evon Terri L | $95,800 | |
| Previous Owner | Evon Terri L | $71,200 | |
| Closed | Evon Terri L | $6,800 | |
| Closed | Harper Jonathan D | $10,950 |
Source: Public Records
Tax History Compared to Growth
Tax History
| Year | Tax Paid | Tax Assessment Tax Assessment Total Assessment is a certain percentage of the fair market value that is determined by local assessors to be the total taxable value of land and additions on the property. | Land | Improvement |
|---|---|---|---|---|
| 2024 | $1,017 | $45,475 | $0 | $0 |
| 2023 | $1,847 | $45,475 | $0 | $0 |
| 2022 | $1,558 | $45,475 | $0 | $0 |
| 2021 | $1,750 | $45,475 | $0 | $0 |
| 2020 | $1,683 | $35,025 | $0 | $0 |
| 2019 | $1,683 | $35,025 | $0 | $0 |
| 2018 | $1,683 | $35,025 | $0 | $0 |
| 2017 | $1,611 | $35,025 | $0 | $0 |
| 2016 | $1,581 | $0 | $0 | $0 |
| 2015 | $1,581 | $32,875 | $0 | $0 |
| 2014 | $1,581 | $0 | $0 | $0 |
Source: Public Records
Map
Nearby Homes
- 201 Signal View St
- 116 Signal View St
- 105 P'Poole Ave
- 127 P Poole Ave
- 203 Flora Cir
- 2608 Berkley Dr
- 2430 Ashmore Ave
- 2621 Berkley Dr
- 2285 Ashmore Ave
- 918 Lullwater Rd
- 229 Sweetland Dr
- 0 Sweetland Dr Unit 1508246
- 300 Sweetland Dr
- 200 Vreeland St
- 118 Hendricks Blvd
- 185 W Ridgewood Ave
- 3117 Carlton Ave
- 523 Hedgewood Dr
- 2583 Highpoint Dr
- 302 W Midvale Ave
- 205 Signal View St
- 209 Signal View St
- 2512 Nonova Ln
- 2512 Nonava Ln
- 206 Signal View St
- 204 Signal View St
- 211 Signal View St
- 2508 Fyffe Ave
- 208 Signal View St
- 208 Signal View St Unit PT8
- 113 Signal View St
- 113 Signal View St Unit 3
- 113 Signal View St Unit 1
- 2511 Nonova Ln
- 111 Signal View St
- 210 Signal View St
- 215 Signal View St
- 2512 Fyffe Ave
- 109 Signal View St
- 109 Signal View St Unit C&D