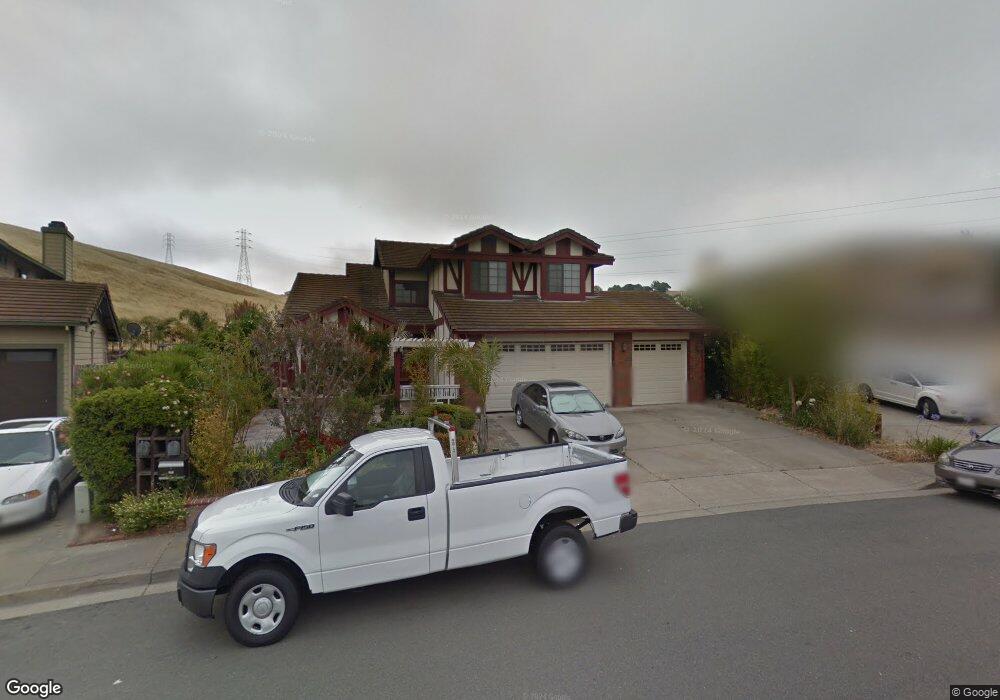
205 Tanager Way Hercules, CA 94547
Estimated Value: $803,000 - $1,034,000
5
Beds
3
Baths
2,346
Sq Ft
$390/Sq Ft
Est. Value
About This Home
This home is located at 205 Tanager Way, Hercules, CA 94547 and is currently estimated at $915,913, approximately $390 per square foot. 205 Tanager Way is a home located in Contra Costa County with nearby schools including Hanna Ranch Elementary School, Hercules Middle School, and Hercules High School.
Ownership History
Date
Name
Owned For
Owner Type
Purchase Details
Closed on
Jan 28, 2009
Sold by
The Norma C Joya Living Trust
Bought by
Tran Hang Nga Thi and Tran My Trang Thi
Current Estimated Value
Home Financials for this Owner
Home Financials are based on the most recent Mortgage that was taken out on this home.
Original Mortgage
$384,000
Outstanding Balance
$241,954
Interest Rate
5.04%
Mortgage Type
Purchase Money Mortgage
Estimated Equity
$673,959
Purchase Details
Closed on
May 7, 2008
Sold by
Joya Norma C and Joya Ivan E
Bought by
Joya Norma C and Joya Ivan E
Purchase Details
Closed on
Dec 12, 2007
Sold by
Joya Norma and Joya Ivan
Bought by
Joya Ivan E and Joya Norma C
Home Financials for this Owner
Home Financials are based on the most recent Mortgage that was taken out on this home.
Original Mortgage
$417,000
Interest Rate
5.62%
Mortgage Type
New Conventional
Purchase Details
Closed on
Jun 21, 2006
Sold by
Joya Ivan E and Joya Norma C
Bought by
Joya Ivan E and Joya Norma C
Create a Home Valuation Report for This Property
The Home Valuation Report is an in-depth analysis detailing your home's value as well as a comparison with similar homes in the area
Home Values in the Area
Average Home Value in this Area
Purchase History
| Date | Buyer | Sale Price | Title Company |
|---|---|---|---|
| Tran Hang Nga Thi | $480,000 | First American Title Company | |
| Joya Norma C | -- | None Available | |
| Joya Norma C | -- | None Available | |
| Joya Ivan E | -- | Fidelity National Title Co | |
| Joya Norma | -- | Fidelity National Title Co | |
| Joya Ivan E | -- | None Available |
Source: Public Records
Mortgage History
| Date | Status | Borrower | Loan Amount |
|---|---|---|---|
| Open | Tran Hang Nga Thi | $384,000 | |
| Previous Owner | Joya Norma | $417,000 |
Source: Public Records
Tax History Compared to Growth
Tax History
| Year | Tax Paid | Tax Assessment Tax Assessment Total Assessment is a certain percentage of the fair market value that is determined by local assessors to be the total taxable value of land and additions on the property. | Land | Improvement |
|---|---|---|---|---|
| 2025 | $12,171 | $839,658 | $361,879 | $477,779 |
| 2024 | $11,960 | $823,195 | $354,784 | $468,411 |
| 2023 | $11,960 | $807,055 | $347,828 | $459,227 |
| 2022 | $9,133 | $582,461 | $182,016 | $400,445 |
| 2021 | $9,127 | $571,042 | $178,448 | $392,594 |
| 2019 | $8,609 | $554,106 | $173,156 | $380,950 |
| 2018 | $8,354 | $543,242 | $169,761 | $373,481 |
| 2017 | $8,226 | $532,591 | $166,433 | $366,158 |
| 2016 | $8,061 | $522,149 | $163,170 | $358,979 |
| 2015 | $8,083 | $514,307 | $160,720 | $353,587 |
| 2014 | $8,039 | $504,233 | $157,572 | $346,661 |
Source: Public Records
Map
Nearby Homes
- 211 Tanager Way
- 199 Tanager Way
- 193 Tanager Way
- 208 Tanager Way
- 196 Tanager Way
- 187 Tanager Way
- 2149 Pheasant Dr
- 184 Tanager Way
- 2202 Pheasant Dr
- 2152 Pheasant Dr
- 2143 Pheasant Dr
- 181 Tanager Way
- 2208 Pheasant Dr
- 172 Tanager Way
- 2146 Pheasant Dr
- 2214 Pheasant Dr
- 175 Tanager Way
- 2137 Pheasant Dr
- 160 Tanager Way
- 2140 Pheasant Dr