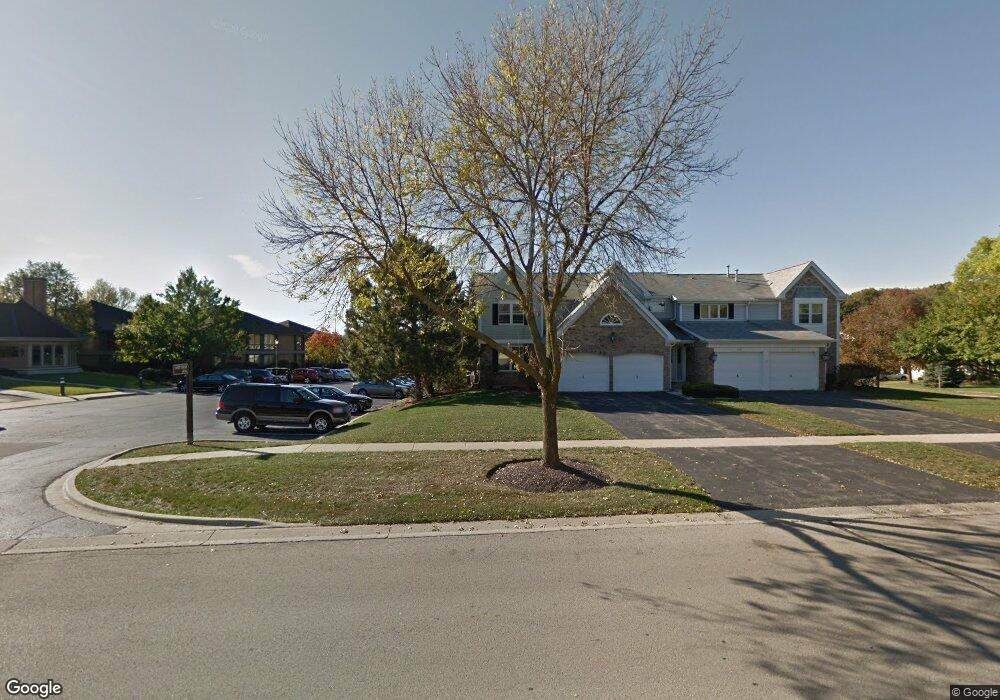
205 Timbers Trail Unit L Saint Charles, IL 60174
Wildrose NeighborhoodEstimated Value: $295,000 - $315,721
2
Beds
3
Baths
1,105
Sq Ft
$275/Sq Ft
Est. Value
About This Home
This home is located at 205 Timbers Trail Unit L, Saint Charles, IL 60174 and is currently estimated at $303,430, approximately $274 per square foot. 205 Timbers Trail Unit L is a home located in Kane County with nearby schools including Wild Rose Elementary School, Wredling Middle School, and St Charles North High School.
Ownership History
Date
Name
Owned For
Owner Type
Purchase Details
Closed on
Oct 13, 2022
Sold by
Hagle Joan E
Bought by
Hagle Joan E and Newbill Jeffrey D
Current Estimated Value
Purchase Details
Closed on
Jun 18, 2004
Sold by
Obenauer Mathias
Bought by
Hagle Joan E
Home Financials for this Owner
Home Financials are based on the most recent Mortgage that was taken out on this home.
Original Mortgage
$148,800
Interest Rate
5.25%
Mortgage Type
Purchase Money Mortgage
Purchase Details
Closed on
Sep 13, 2000
Sold by
Wellman C Randall and Wellman Jeanine L
Bought by
Obenauer Mathias
Home Financials for this Owner
Home Financials are based on the most recent Mortgage that was taken out on this home.
Original Mortgage
$135,000
Interest Rate
8.14%
Create a Home Valuation Report for This Property
The Home Valuation Report is an in-depth analysis detailing your home's value as well as a comparison with similar homes in the area
Home Values in the Area
Average Home Value in this Area
Purchase History
| Date | Buyer | Sale Price | Title Company |
|---|---|---|---|
| Hagle Joan E | -- | None Listed On Document | |
| Hagle Joan E | $186,000 | Attorneys Title Guaranty Fun | |
| Obenauer Mathias | $160,000 | Chicago Title Insurance Co |
Source: Public Records
Mortgage History
| Date | Status | Borrower | Loan Amount |
|---|---|---|---|
| Previous Owner | Hagle Joan E | $148,800 | |
| Previous Owner | Obenauer Mathias | $135,000 |
Source: Public Records
Tax History Compared to Growth
Tax History
| Year | Tax Paid | Tax Assessment Tax Assessment Total Assessment is a certain percentage of the fair market value that is determined by local assessors to be the total taxable value of land and additions on the property. | Land | Improvement |
|---|---|---|---|---|
| 2024 | $5,167 | $85,611 | $18,620 | $66,991 |
| 2023 | $3,766 | $76,623 | $16,665 | $59,958 |
| 2022 | $4,203 | $71,237 | $18,446 | $52,791 |
| 2021 | $4,245 | $67,903 | $17,583 | $50,320 |
| 2020 | $4,284 | $63,049 | $17,255 | $45,794 |
| 2019 | $4,193 | $61,800 | $16,913 | $44,887 |
| 2018 | $3,795 | $56,753 | $16,270 | $40,483 |
| 2017 | $3,671 | $54,813 | $15,714 | $39,099 |
| 2016 | $3,827 | $52,888 | $15,162 | $37,726 |
| 2015 | -- | $48,668 | $14,999 | $33,669 |
| 2014 | -- | $47,111 | $14,999 | $32,112 |
| 2013 | -- | $47,935 | $15,149 | $32,786 |
Source: Public Records
Map
Nearby Homes
- 205 Auburn Ct Unit 205
- 231 Sedgewick Cir
- 107 N 3rd Ave
- 3N866 Ferson Creek Rd
- 50 S 1st St Unit 5D
- 1034 N 5th Ave
- 106 Sumac Ct
- 615 Marion Ave
- 311 Ohio Ave
- 921 Oak Crest Ln Unit 1
- 4N675 Old Farm Rd
- 1017 S 6th St
- 1028 S 5th St
- 1108 S 12th St Unit 2
- 885 Geneva Rd
- Lot 1 Keller Place
- 1309 Fox Chase Blvd
- 1330-1332 S 14th St
- 135 Thornhill Farm Ln Unit 1
- 1336-1338 S 14th St
- 207 Timbers Trail Unit TC17HL
- 207 Timbers Trail Unit 2
- 209 Timbers Trail Unit 17H
- 211 Timbers Trail Unit 17F
- 106 Millington Way Unit R
- 108 Millington Way Unit R
- 104 Millington Way Unit 16H
- 102 Millington Way Unit 16F
- 206 Timbers Trail
- Lot 96 River Dr
- 302 Timbers Trail
- 248 W River Dr
- 103 Millington Way
- 202 Timbers Trail
- 244 W River Dr
- 250 W River Dr
- 240 W River Dr Unit 2B
- 114 Millington Way Unit 15H
- 112 Millington Way Unit 15F
- 116 Millington Way Unit 15H