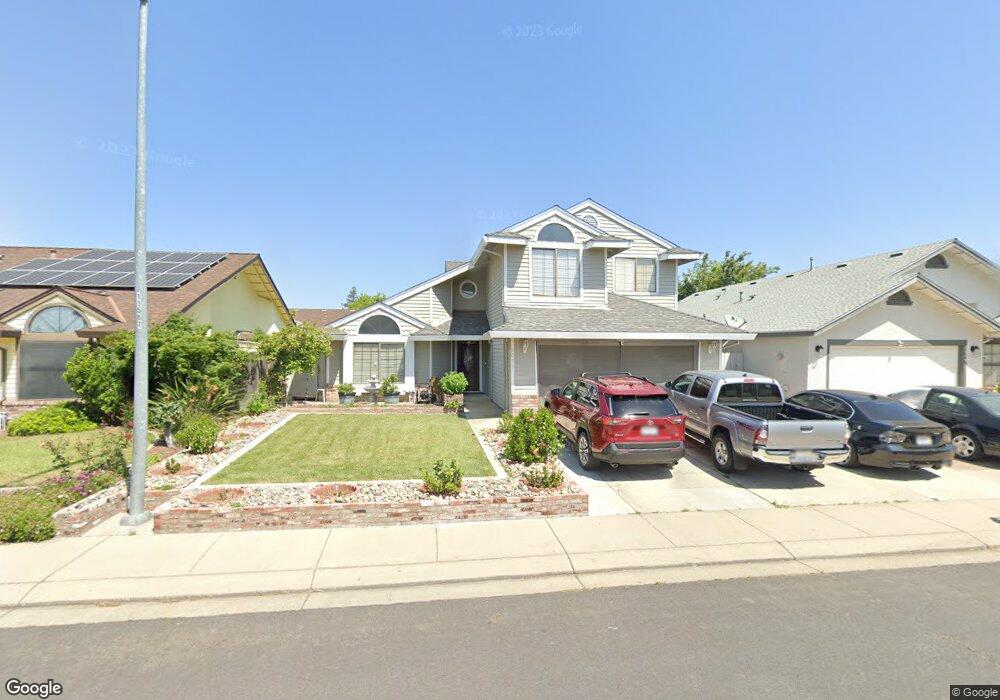
2053 Elwin Way Modesto, CA 95350
Estimated Value: $429,000 - $488,000
4
Beds
3
Baths
1,853
Sq Ft
$248/Sq Ft
Est. Value
About This Home
This home is located at 2053 Elwin Way, Modesto, CA 95350 and is currently estimated at $459,647, approximately $248 per square foot. 2053 Elwin Way is a home located in Stanislaus County with nearby schools including George Eisenhut Elementary School, Prescott Junior High School, and Grace M. Davis High School.
Ownership History
Date
Name
Owned For
Owner Type
Purchase Details
Closed on
Jun 10, 2019
Sold by
Nand Vijay and Nand Roshni
Bought by
The Nand Family Trust
Current Estimated Value
Purchase Details
Closed on
Apr 21, 2004
Sold by
Nand Roshni and Nand Vijay
Bought by
Nand Vijay and Nand Roshni
Home Financials for this Owner
Home Financials are based on the most recent Mortgage that was taken out on this home.
Original Mortgage
$160,200
Interest Rate
7.65%
Mortgage Type
Purchase Money Mortgage
Purchase Details
Closed on
Aug 1, 1997
Sold by
Ovalle Rodolfo E and Ovalle Teresa
Bought by
Nand Roshni and Nand Vijay
Home Financials for this Owner
Home Financials are based on the most recent Mortgage that was taken out on this home.
Original Mortgage
$107,000
Interest Rate
7.45%
Create a Home Valuation Report for This Property
The Home Valuation Report is an in-depth analysis detailing your home's value as well as a comparison with similar homes in the area
Purchase History
| Date | Buyer | Sale Price | Title Company |
|---|---|---|---|
| The Nand Family Trust | -- | None Available | |
| Nand Vijay | -- | North American Title Company | |
| Nand Roshni | $145,000 | First American Title Co |
Source: Public Records
Mortgage History
| Date | Status | Borrower | Loan Amount |
|---|---|---|---|
| Open | Nand Vijay | $160,200 | |
| Closed | Nand Roshni | $107,000 |
Source: Public Records
Tax History
| Year | Tax Paid | Tax Assessment Tax Assessment Total Assessment is a certain percentage of the fair market value that is determined by local assessors to be the total taxable value of land and additions on the property. | Land | Improvement |
|---|---|---|---|---|
| 2025 | $2,588 | $231,512 | $55,879 | $175,633 |
| 2024 | $2,495 | $226,974 | $54,784 | $172,190 |
| 2023 | $2,448 | $222,524 | $53,710 | $168,814 |
| 2022 | $2,380 | $218,161 | $52,657 | $165,504 |
| 2021 | $2,248 | $213,884 | $51,625 | $162,259 |
| 2020 | $2,217 | $211,692 | $51,096 | $160,596 |
| 2019 | $2,190 | $207,543 | $50,095 | $157,448 |
| 2018 | $2,162 | $203,474 | $49,113 | $154,361 |
| 2017 | $2,110 | $199,485 | $48,150 | $151,335 |
| 2016 | $2,053 | $195,574 | $47,206 | $148,368 |
| 2015 | $2,034 | $192,637 | $46,497 | $146,140 |
| 2014 | $2,011 | $188,865 | $45,587 | $143,278 |
Source: Public Records
Map
Nearby Homes
- 3101 Wyatt Way
- 2124 Key West Ln
- 2128 Barrington Ln
- 2129 Viking Ln
- 3037 Holiday Ln
- 2224 Northridge Dr
- 1805 Glaston Ave
- 2800 Prescott Rd
- 3040 Maplenut Ave
- 2621 Prescott Rd Unit 224
- 2621 Prescott Rd Unit 79
- 2621 Prescott Rd Unit 277
- 2621 Prescott Rd Unit 242
- 2621 Prescott Rd Unit 262
- 2621 Prescott Rd Unit 53
- 2621 Prescott Rd Unit 151
- 3604 Veneman Ave N
- 3601 Agate Dr
- 3652 Veneman Ave N
- 1905 Shell Ct
- 2049 Elwin Way
- 2057 Elwin Way
- 2045 Elwin Way
- 2052 Zaiger Way
- 2056 Zaiger Way
- 2061 Elwin Way
- 2048 Zaiger Way
- 2060 Zaiger Way
- 2041 Elwin Way
- 2048 Elwin Way
- 2044 Zaiger Way
- 2052 Elwin Way
- 2044 Elwin Way
- 2065 Elwin Way
- 2056 Elwin Way
- 2064 Zaiger Way
- 2040 Elwin Way
- 2040 Zaiger Way
- 2037 Elwin Way
- 2060 Elwin Way
Your Personal Tour Guide
Ask me questions while you tour the home.