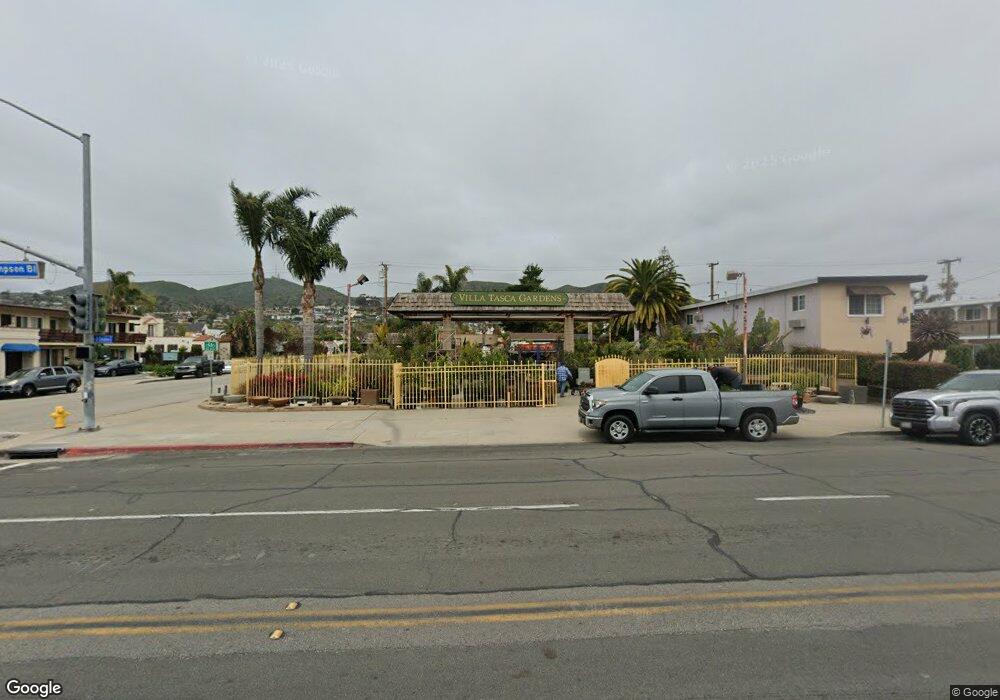
2057 E Thompson Blvd Ventura, CA 93001
Midtown NeighborhoodEstimated Value: $461,067
--
Bed
--
Bath
132
Sq Ft
$3,493/Sq Ft
Est. Value
About This Home
This home is located at 2057 E Thompson Blvd, Ventura, CA 93001 and is currently estimated at $461,067, approximately $3,492 per square foot. 2057 E Thompson Blvd is a home located in Ventura County with nearby schools including Lincoln Elementary School, Cabrillo Middle School, and Ventura High School.
Ownership History
Date
Name
Owned For
Owner Type
Purchase Details
Closed on
Feb 2, 2011
Sold by
Ventura Properties
Bought by
Zardouz Khosro
Current Estimated Value
Purchase Details
Closed on
Dec 3, 1998
Sold by
Hart Maria Mata
Bought by
Hart Richard
Purchase Details
Closed on
Dec 19, 1996
Sold by
Anenberg Noel Alan
Bought by
Anenberg Noel Alan and Anenberg Sheri Lynn
Purchase Details
Closed on
Aug 24, 1995
Sold by
Anenberg Noel Alan
Bought by
Ventura Properties
Purchase Details
Closed on
Aug 21, 1995
Sold by
Saxon Daniel
Bought by
Ventura Properties
Purchase Details
Closed on
Aug 18, 1995
Sold by
Anenberg Gerald
Bought by
Ventura Properties
Purchase Details
Closed on
Aug 17, 1995
Sold by
Garfield Sanford and Garfield Bernice Henrietta
Bought by
Ventura Properties
Purchase Details
Closed on
Aug 16, 1995
Sold by
Miller Marceile
Bought by
Ventura Properties
Create a Home Valuation Report for This Property
The Home Valuation Report is an in-depth analysis detailing your home's value as well as a comparison with similar homes in the area
Home Values in the Area
Average Home Value in this Area
Purchase History
| Date | Buyer | Sale Price | Title Company |
|---|---|---|---|
| Zardouz Khosro | $197,500 | Chicago Title Company | |
| Hart Richard | -- | American Title Co | |
| Anenberg Noel Alan | -- | -- | |
| Ventura Properties | -- | -- | |
| Ventura Properties | -- | -- | |
| Ventura Properties | -- | -- | |
| Ventura Properties | -- | -- | |
| Ventura Properties | -- | -- |
Source: Public Records
Tax History Compared to Growth
Tax History
| Year | Tax Paid | Tax Assessment Tax Assessment Total Assessment is a certain percentage of the fair market value that is determined by local assessors to be the total taxable value of land and additions on the property. | Land | Improvement |
|---|---|---|---|---|
| 2025 | $3,040 | $266,204 | $243,416 | $22,788 |
| 2024 | $3,040 | $260,985 | $238,643 | $22,342 |
| 2023 | $3,005 | $255,868 | $233,964 | $21,904 |
| 2022 | $2,808 | $250,851 | $229,376 | $21,475 |
| 2021 | $2,757 | $245,933 | $224,879 | $21,054 |
| 2020 | $2,725 | $243,413 | $222,574 | $20,839 |
| 2019 | $2,677 | $238,641 | $218,210 | $20,431 |
| 2018 | $2,635 | $233,963 | $213,932 | $20,031 |
| 2017 | $2,579 | $229,377 | $209,738 | $19,639 |
| 2016 | $2,531 | $224,880 | $205,626 | $19,254 |
| 2015 | $2,506 | $221,505 | $202,539 | $18,966 |
| 2014 | $2,467 | $217,168 | $198,572 | $18,596 |
Source: Public Records
Map
Nearby Homes
- 44 Coronado St Unit 202
- 66 San Clemente St
- 205 Jordan Ave
- Plan D at Portalvo - Townhomes
- Plan F at Portalvo - Townhomes
- Plan E at Portalvo - Townhomes
- Plan O at Portalvo - Condos/Flats
- Plan A at Portalvo - Townhomes
- Plan H at Portalvo - Condos/Flats
- Plan L at Portalvo - Condos/Flats
- Plan C at Portalvo - Townhomes
- Plan B at Portalvo - Townhomes
- Plan J at Portalvo - Condos/Flats
- Plan G at Portalvo - Townhomes
- Plan N at Portalvo - Condos/Flats
- Plan K at Portalvo - Condos/Flats
- Plan M at Portalvo - Condos/Flats
- 1907 Ocean Ave
- 69 S Seaward Ave
- 1901 Ocean Ave
- 224 S Catalina St
- 2045 E Thompson Blvd
- 2111 E Thompson Blvd
- 216 S Catalina St
- 2113 1 2 Thompson E Unit E
- 225 S Catalina St
- 231 San Clemente St
- 208 S Catalina St
- 225 San Clemente St
- 217 S Catalina St
- 215 San Clemente St
- 2110 E Thompson Blvd
- 198 S Catalina St
- 209 S Catalina St
- 205 San Clemente St
- 199 S Catalina St
- 190 S Catalina St
- 195 San Clemente St
- 222 Anacapa St
- 294 S Catalina St