Estimated Value: $317,000 - $425,000
3
Beds
2
Baths
1,041
Sq Ft
$369/Sq Ft
Est. Value
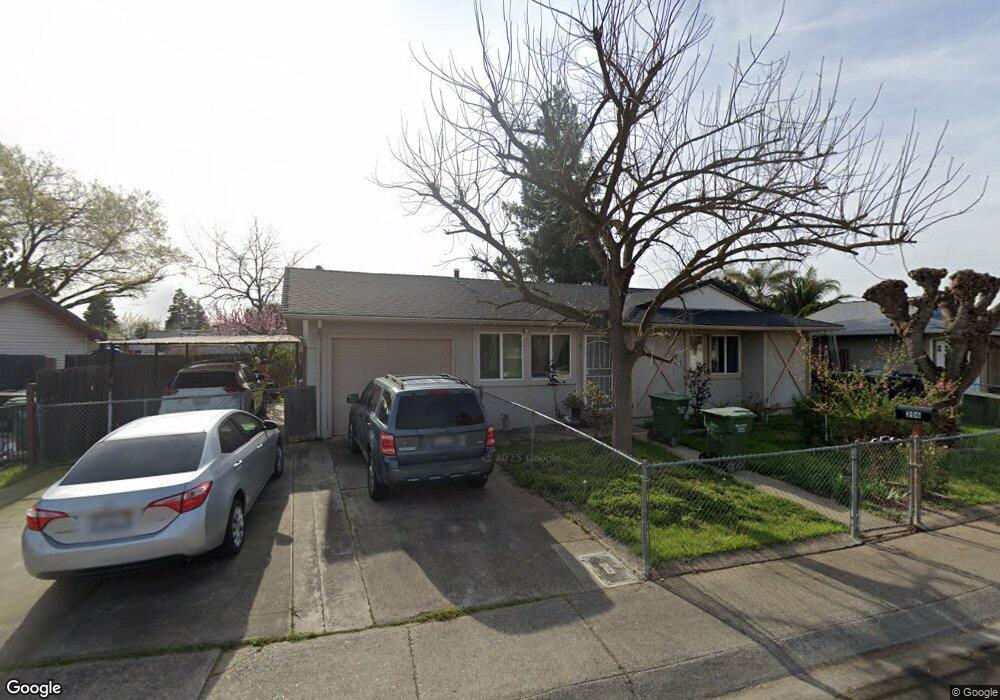
About This Home
This home is located at 206 Downing Dr, Galt, CA 95632 and is currently estimated at $384,427, approximately $369 per square foot. 206 Downing Dr is a home located in Sacramento County with nearby schools including Valley Oaks Elementary School, Robert L. McCaffrey Middle School, and Galt High School.
Ownership History
Date
Name
Owned For
Owner Type
Purchase Details
Closed on
Apr 28, 2025
Sold by
Gonzalez Samuel and Gonzalez Rosaura Carbajal
Bought by
Samuel Gonzalez And Rosaura Carbajal Gonzalez and Gonzalez
Current Estimated Value
Purchase Details
Closed on
Jan 24, 2020
Sold by
Oropeza Salvador and Rosarlo Teodora E
Bought by
Oropeza Salvador and Rosarlo Teodora E
Home Financials for this Owner
Home Financials are based on the most recent Mortgage that was taken out on this home.
Original Mortgage
$181,000
Interest Rate
3.7%
Mortgage Type
New Conventional
Purchase Details
Closed on
May 24, 2017
Sold by
Gonzazlez Samuel
Bought by
Gonzalez Samuel and Gonzalez Rosaura Carbajal
Purchase Details
Closed on
Aug 26, 2003
Sold by
Gonzalez John and Gonzalez Andrea
Bought by
Oropeza Salvador and Oropeza Teodora
Create a Home Valuation Report for This Property
The Home Valuation Report is an in-depth analysis detailing your home's value as well as a comparison with similar homes in the area
Home Values in the Area
Average Home Value in this Area
Purchase History
| Date | Buyer | Sale Price | Title Company |
|---|---|---|---|
| Samuel Gonzalez And Rosaura Carbajal Gonzalez | -- | None Listed On Document | |
| Oropeza Salvador | -- | Old Republic Title Company | |
| Gonzalez Samuel | -- | None Available | |
| Oropeza Salvador | $210,000 | Chicago Title Co |
Source: Public Records
Mortgage History
| Date | Status | Borrower | Loan Amount |
|---|---|---|---|
| Previous Owner | Oropeza Salvador | $181,000 | |
| Closed | Oropeza Salvador | $0 |
Source: Public Records
Tax History
| Year | Tax Paid | Tax Assessment Tax Assessment Total Assessment is a certain percentage of the fair market value that is determined by local assessors to be the total taxable value of land and additions on the property. | Land | Improvement |
|---|---|---|---|---|
| 2025 | $3,286 | $298,555 | $56,858 | $241,697 |
| 2024 | $3,286 | $292,702 | $55,744 | $236,958 |
| 2023 | $3,230 | $286,963 | $54,651 | $232,312 |
| 2022 | $3,100 | $281,337 | $53,580 | $227,757 |
| 2021 | $3,104 | $275,822 | $52,530 | $223,292 |
| 2020 | $3,078 | $272,995 | $51,992 | $221,003 |
| 2019 | $3,002 | $267,643 | $50,973 | $216,670 |
| 2018 | $2,997 | $262,396 | $49,974 | $212,422 |
| 2017 | $2,650 | $236,744 | $45,089 | $191,655 |
| 2016 | $2,361 | $215,222 | $40,990 | $174,232 |
| 2015 | $2,225 | $206,945 | $39,414 | $167,531 |
| 2014 | $2,077 | $189,858 | $36,160 | $153,698 |
Source: Public Records
Map
Nearby Homes
Your Personal Tour Guide
Ask me questions while you tour the home.