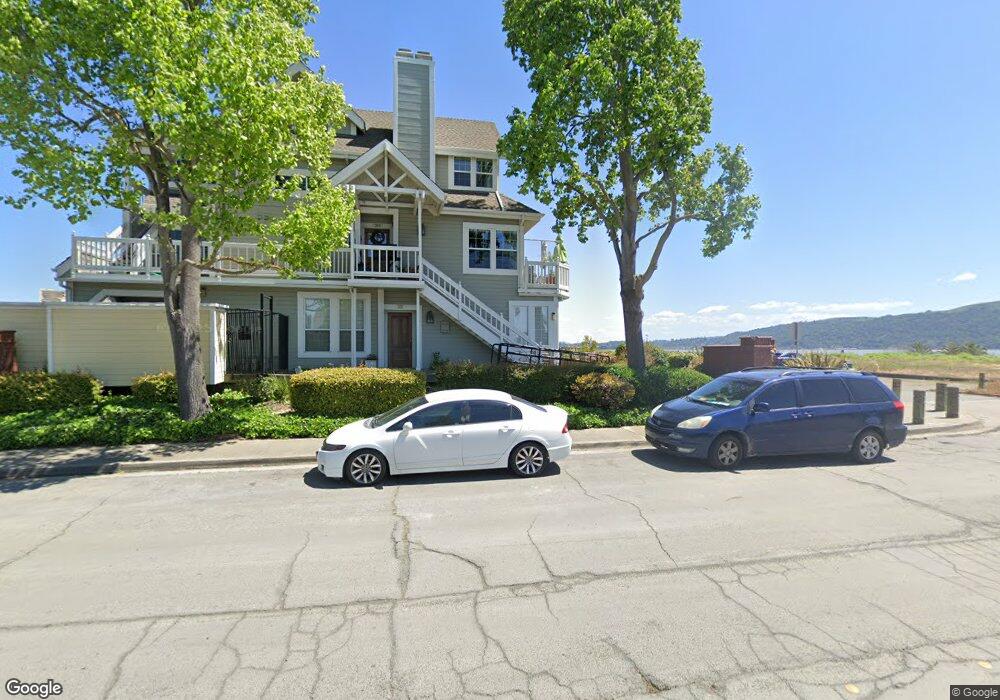
206 E 2nd St Unit 3 Benicia, CA 94510
Estimated Value: $648,000 - $764,000
3
Beds
3
Baths
1,409
Sq Ft
$497/Sq Ft
Est. Value
About This Home
This home is located at 206 E 2nd St Unit 3, Benicia, CA 94510 and is currently estimated at $699,817, approximately $496 per square foot. 206 E 2nd St Unit 3 is a home located in Solano County with nearby schools including Mary Farmar Elementary School, Benicia Middle School, and Benicia High School.
Ownership History
Date
Name
Owned For
Owner Type
Purchase Details
Closed on
May 15, 2001
Sold by
Buenaventura Joseph Verne
Bought by
Brigino Buenaventura Emerita
Current Estimated Value
Home Financials for this Owner
Home Financials are based on the most recent Mortgage that was taken out on this home.
Original Mortgage
$301,500
Outstanding Balance
$112,580
Interest Rate
7.03%
Estimated Equity
$587,237
Purchase Details
Closed on
May 14, 2001
Sold by
Forrest Susan E
Bought by
Buenaventura Emerita Brigino
Home Financials for this Owner
Home Financials are based on the most recent Mortgage that was taken out on this home.
Original Mortgage
$301,500
Outstanding Balance
$112,580
Interest Rate
7.03%
Estimated Equity
$587,237
Create a Home Valuation Report for This Property
The Home Valuation Report is an in-depth analysis detailing your home's value as well as a comparison with similar homes in the area
Home Values in the Area
Average Home Value in this Area
Purchase History
| Date | Buyer | Sale Price | Title Company |
|---|---|---|---|
| Brigino Buenaventura Emerita | -- | North American Title Co | |
| Buenaventura Emerita Brigino | $335,000 | North American Title Co |
Source: Public Records
Mortgage History
| Date | Status | Borrower | Loan Amount |
|---|---|---|---|
| Open | Buenaventura Emerita Brigino | $301,500 | |
| Closed | Buenaventura Emerita Brigino | $20,000 |
Source: Public Records
Tax History
| Year | Tax Paid | Tax Assessment Tax Assessment Total Assessment is a certain percentage of the fair market value that is determined by local assessors to be the total taxable value of land and additions on the property. | Land | Improvement |
|---|---|---|---|---|
| 2025 | $6,064 | $517,139 | $87,691 | $429,448 |
| 2024 | $6,064 | $507,000 | $85,972 | $421,028 |
| 2023 | $5,918 | $497,060 | $84,287 | $412,773 |
| 2022 | $5,809 | $487,315 | $82,635 | $404,680 |
| 2021 | $5,690 | $477,761 | $81,015 | $396,746 |
| 2020 | $5,615 | $472,863 | $80,185 | $392,678 |
| 2019 | $5,517 | $463,592 | $78,613 | $384,979 |
| 2018 | $5,377 | $454,503 | $77,072 | $377,431 |
| 2017 | $5,252 | $445,592 | $75,561 | $370,031 |
| 2016 | $5,296 | $436,856 | $74,080 | $362,776 |
| 2015 | $4,727 | $394,000 | $59,000 | $335,000 |
| 2014 | $5,043 | $417,000 | $63,000 | $354,000 |
Source: Public Records
Map
Nearby Homes
Your Personal Tour Guide
Ask me questions while you tour the home.