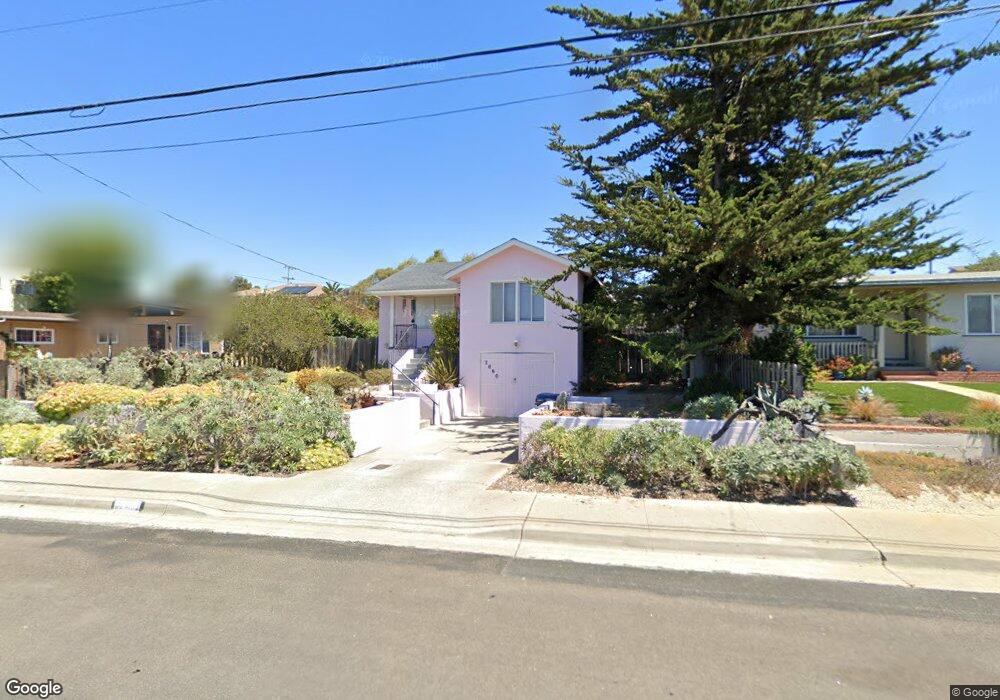
2060 Waring St Seaside, CA 93955
Estimated Value: $691,607 - $740,000
2
Beds
1
Bath
934
Sq Ft
$762/Sq Ft
Est. Value
About This Home
This home is located at 2060 Waring St, Seaside, CA 93955 and is currently estimated at $711,402, approximately $761 per square foot. 2060 Waring St is a home located in Monterey County with nearby schools including Ord Terrace Elementary School, Seaside Middle School, and Seaside High School.
Ownership History
Date
Name
Owned For
Owner Type
Purchase Details
Closed on
Jan 14, 2015
Sold by
Marquez Janis C
Bought by
Marquez Janis C and The Janis C Marquez Living Tru
Current Estimated Value
Purchase Details
Closed on
Dec 3, 1997
Sold by
Beason Brian H and Beason Kelly R
Bought by
Marquez Janis C
Home Financials for this Owner
Home Financials are based on the most recent Mortgage that was taken out on this home.
Original Mortgage
$117,000
Outstanding Balance
$19,724
Interest Rate
7.19%
Estimated Equity
$691,678
Purchase Details
Closed on
Sep 15, 1994
Sold by
Mccann Michael P and Mccann Shannon C
Bought by
Beason Brian H and Beason Kelly R
Home Financials for this Owner
Home Financials are based on the most recent Mortgage that was taken out on this home.
Original Mortgage
$150,450
Interest Rate
8.37%
Mortgage Type
Assumption
Create a Home Valuation Report for This Property
The Home Valuation Report is an in-depth analysis detailing your home's value as well as a comparison with similar homes in the area
Home Values in the Area
Average Home Value in this Area
Purchase History
| Date | Buyer | Sale Price | Title Company |
|---|---|---|---|
| Marquez Janis C | -- | None Available | |
| Marquez Janis C | $163,000 | Stewart Title | |
| Beason Brian H | $147,500 | Stewart Title |
Source: Public Records
Mortgage History
| Date | Status | Borrower | Loan Amount |
|---|---|---|---|
| Open | Marquez Janis C | $117,000 | |
| Previous Owner | Beason Brian H | $150,450 |
Source: Public Records
Tax History
| Year | Tax Paid | Tax Assessment Tax Assessment Total Assessment is a certain percentage of the fair market value that is determined by local assessors to be the total taxable value of land and additions on the property. | Land | Improvement |
|---|---|---|---|---|
| 2025 | $2,705 | $260,238 | $127,721 | $132,517 |
| 2024 | $2,705 | $255,136 | $125,217 | $129,919 |
| 2023 | $2,715 | $250,134 | $122,762 | $127,372 |
| 2022 | $2,676 | $245,230 | $120,355 | $124,875 |
| 2021 | $2,636 | $240,423 | $117,996 | $122,427 |
| 2020 | $2,537 | $237,959 | $116,787 | $121,172 |
| 2019 | $2,657 | $233,295 | $114,498 | $118,797 |
| 2018 | $2,552 | $228,721 | $112,253 | $116,468 |
| 2017 | $2,365 | $224,237 | $110,052 | $114,185 |
| 2016 | $2,322 | $219,842 | $107,895 | $111,947 |
| 2015 | $2,288 | $216,541 | $106,275 | $110,266 |
| 2014 | $2,248 | $212,301 | $104,194 | $108,107 |
Source: Public Records
Map
Nearby Homes
- 1986 Luxton St
- 1355 La Salle Ave
- 1809 Vallejo St
- 1206 La Salle Ave Unit 7
- 2080 Buchanan St
- 1740 Judson St
- 1714 Luxton St
- 1688 Harding St
- 1659 Judson St
- 4460 Ocean Heights Ct
- 1666 Hilton St
- 1790 Fernando St
- 1146 Birch Ave Unit 19
- 0 Tioga Ave Unit ML82030096
- 1732 Fernando St
- 1610 Soto St
- 1125 Olympia Ave
- 4386 Parker Flats
- 1580 Ancon St
- 2660 Bay Ave
Your Personal Tour Guide
Ask me questions while you tour the home.