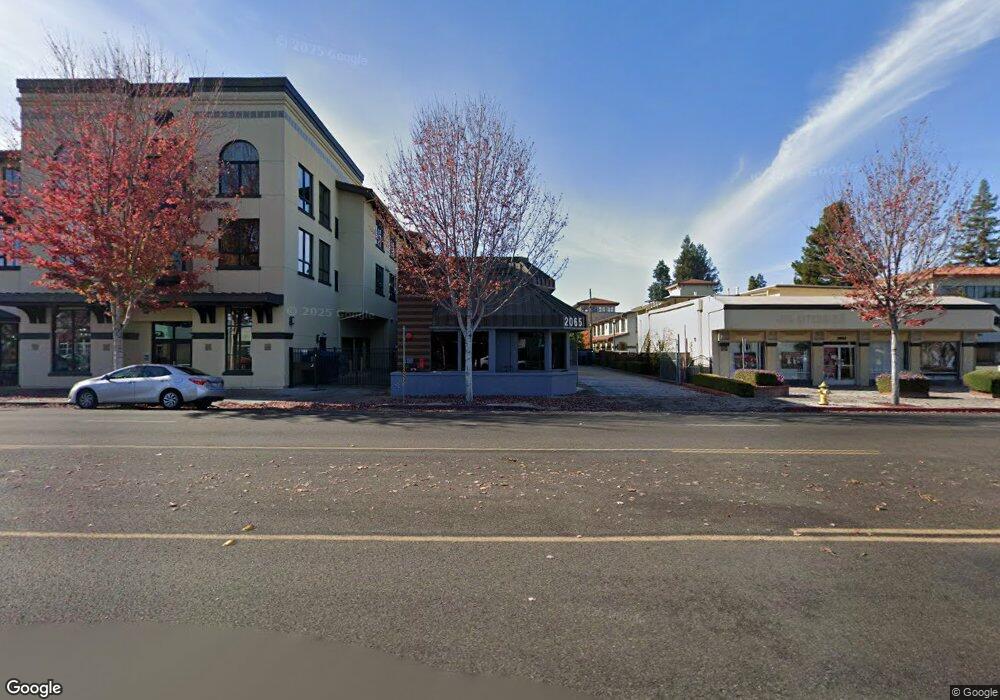
2065 Winchester Blvd Campbell, CA 95008
Downtown Campbell NeighborhoodEstimated Value: $2,258,361
Studio
--
Bath
3,830
Sq Ft
$590/Sq Ft
Est. Value
About This Home
This home is located at 2065 Winchester Blvd, Campbell, CA 95008 and is currently estimated at $2,258,361, approximately $589 per square foot. 2065 Winchester Blvd is a home located in Santa Clara County with nearby schools including Westmont High School, Campbell School of Innovation, and Capri Elementary.
Ownership History
Date
Name
Owned For
Owner Type
Purchase Details
Closed on
Jun 23, 2023
Sold by
Spiteri Patrick M and Spiteri Belinda
Bought by
Patrick M Spiteri And Belinda Spiteri Living and Spiteri
Current Estimated Value
Purchase Details
Closed on
Sep 8, 2017
Sold by
Hanes Donald G
Bought by
Spiteri Patrick M
Home Financials for this Owner
Home Financials are based on the most recent Mortgage that was taken out on this home.
Original Mortgage
$939,000
Interest Rate
3.93%
Mortgage Type
Commercial
Purchase Details
Closed on
Mar 14, 2008
Sold by
Campbell Don H and Campbell Lynda G
Bought by
Hanes Donald G
Home Financials for this Owner
Home Financials are based on the most recent Mortgage that was taken out on this home.
Original Mortgage
$762,500
Interest Rate
5.65%
Mortgage Type
Commercial
Create a Home Valuation Report for This Property
The Home Valuation Report is an in-depth analysis detailing your home's value as well as a comparison with similar homes in the area
Home Values in the Area
Average Home Value in this Area
Purchase History
| Date | Buyer | Sale Price | Title Company |
|---|---|---|---|
| Patrick M Spiteri And Belinda Spiteri Living | -- | None Listed On Document | |
| Spiteri Patrick M | -- | None Listed On Document | |
| Spiteri Patrick M | $1,565,000 | Chicago Title Company | |
| Spiteri Belinda | -- | Chicago Title Company | |
| Hanes Donald G | $1,525,000 | Chicago Title Company |
Source: Public Records
Mortgage History
| Date | Status | Borrower | Loan Amount |
|---|---|---|---|
| Previous Owner | Spiteri Patrick M | $939,000 | |
| Previous Owner | Hanes Donald G | $762,500 |
Source: Public Records
Tax History
| Year | Tax Paid | Tax Assessment Tax Assessment Total Assessment is a certain percentage of the fair market value that is determined by local assessors to be the total taxable value of land and additions on the property. | Land | Improvement |
|---|---|---|---|---|
| 2025 | $21,770 | $1,780,697 | $953,499 | $827,198 |
| 2024 | $21,770 | $1,745,782 | $934,803 | $810,979 |
| 2023 | $21,549 | $1,711,552 | $916,474 | $795,078 |
| 2022 | $21,346 | $1,677,993 | $898,504 | $779,489 |
| 2021 | $20,879 | $1,645,092 | $880,887 | $764,205 |
| 2020 | $20,269 | $1,628,225 | $871,855 | $756,370 |
| 2019 | $20,127 | $1,596,300 | $854,760 | $741,540 |
| 2018 | $19,629 | $1,565,000 | $838,000 | $727,000 |
| 2017 | $19,893 | $1,590,000 | $905,415 | $684,585 |
| 2016 | $17,550 | $1,446,730 | $887,662 | $559,068 |
| 2015 | $17,537 | $1,425,000 | $874,329 | $550,671 |
| 2014 | $16,067 | $1,300,000 | $560,000 | $740,000 |
Source: Public Records
Map
Nearby Homes
- 87 Salice Way
- 101 Sunnyside Ave
- 186 W Rincon Ave
- 188 W Rincon Ave
- 63 Braxton Terrace
- 77 S 1st St
- 143 Kennedy Ave
- 206 Sunnyside Ave
- 283 Esther Ave
- 466 Sam Cava Ln
- 136 Lottie Ln
- 331 N 1st St Unit 3
- 122 Timber Cove Dr Unit 122
- 870 Camden Ave Unit 96
- 99 Timber Cove Dr Unit 99
- 123 Dot Ave
- 341 Carlyn Ave
- 425 Queens Ct
- 271 Wagon Way Unit 38-03 - Plan 4
- 273 Llewellyn Ave Unit 10-18 Plan 2
- 2105 Winchester Blvd Unit 130
- 42 W Campbell Ave Unit 101
- 2096 Winchester Blvd
- 104 Salice Way
- 32 Sanford Ave
- 106 Salice Way
- 108 Salice Way
- 110 Salice Way
- 2006 Winchester Blvd
- 43 W Rincon Ave
- 112 Salice Way
- 44 Sanford Ave
- 37 Sanford Ave
- 84 W Campbell Ave
- 24 E Campbell Ave
- 114 Salice Way
- 116 Salice Way
- 120 Salice Way
- 122 Salice Way
- 28 E Campbell Ave
Your Personal Tour Guide
Ask me questions while you tour the home.