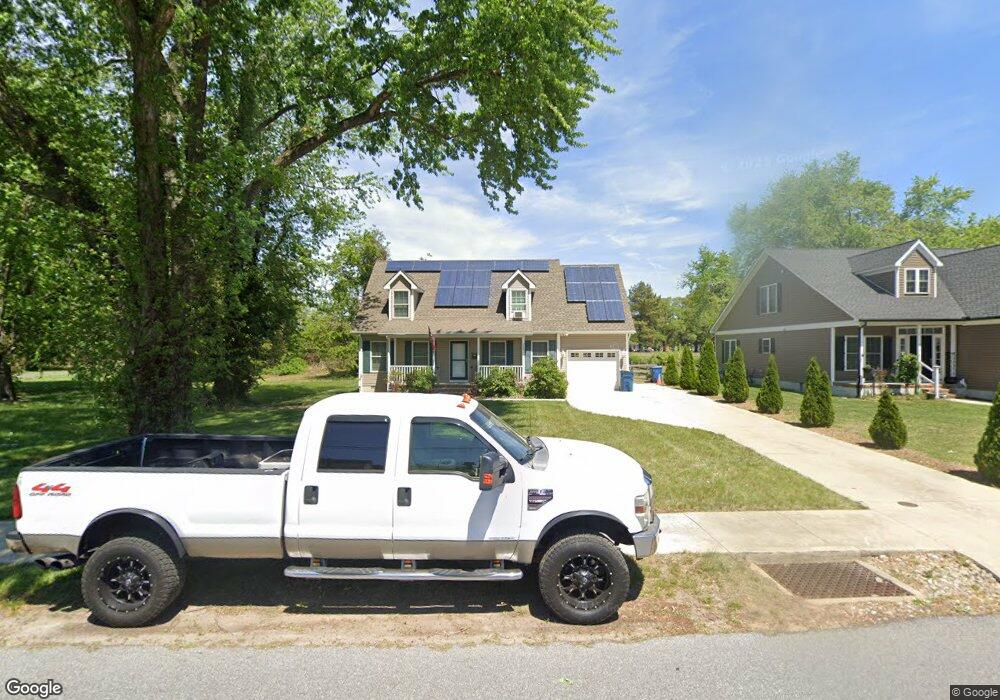
207 Center St Camden, DE 19934
Estimated Value: $319,000 - $374,000
3
Beds
3
Baths
1,638
Sq Ft
$208/Sq Ft
Est. Value
About This Home
This home is located at 207 Center St, Camden, DE 19934 and is currently estimated at $340,692, approximately $207 per square foot. 207 Center St is a home with nearby schools including W.B. Simpson Elementary School, Fred Fifer Middle School, and Caesar Rodney High School.
Ownership History
Date
Name
Owned For
Owner Type
Purchase Details
Closed on
Oct 21, 2020
Sold by
Willoughby Christopher M and Willoughby Kimberly M
Bought by
Willoughby Christopher M
Current Estimated Value
Home Financials for this Owner
Home Financials are based on the most recent Mortgage that was taken out on this home.
Original Mortgage
$200,000
Outstanding Balance
$177,565
Interest Rate
2.8%
Mortgage Type
New Conventional
Estimated Equity
$163,127
Purchase Details
Closed on
Aug 29, 2013
Sold by
King S Carpentry Inc
Bought by
Willoughby Christopher M and Willoughby Kimberly M
Home Financials for this Owner
Home Financials are based on the most recent Mortgage that was taken out on this home.
Original Mortgage
$186,067
Interest Rate
4.5%
Mortgage Type
FHA
Purchase Details
Closed on
Jul 9, 2012
Sold by
Wood Norman
Bought by
Kings Carpentry Inc
Create a Home Valuation Report for This Property
The Home Valuation Report is an in-depth analysis detailing your home's value as well as a comparison with similar homes in the area
Home Values in the Area
Average Home Value in this Area
Purchase History
| Date | Buyer | Sale Price | Title Company |
|---|---|---|---|
| Willoughby Christopher M | -- | None Available | |
| Willoughby Christopher M | -- | None Available | |
| Willoughby Christopher M | $189,500 | None Available | |
| Kings Carpentry Inc | $33,000 | None Available |
Source: Public Records
Mortgage History
| Date | Status | Borrower | Loan Amount |
|---|---|---|---|
| Open | Willoughby Christopher M | $200,000 | |
| Previous Owner | Willoughby Christopher M | $186,067 |
Source: Public Records
Tax History Compared to Growth
Tax History
| Year | Tax Paid | Tax Assessment Tax Assessment Total Assessment is a certain percentage of the fair market value that is determined by local assessors to be the total taxable value of land and additions on the property. | Land | Improvement |
|---|---|---|---|---|
| 2025 | $1,202 | $301,300 | $60,700 | $240,600 |
| 2024 | $1,202 | $301,300 | $60,700 | $240,600 |
| 2023 | $1,078 | $42,200 | $4,200 | $38,000 |
| 2022 | $1,018 | $42,200 | $4,200 | $38,000 |
| 2021 | $1,010 | $42,200 | $4,200 | $38,000 |
| 2020 | $1,005 | $42,200 | $4,200 | $38,000 |
| 2019 | $966 | $42,200 | $4,200 | $38,000 |
| 2018 | $932 | $42,200 | $4,200 | $38,000 |
| 2017 | $906 | $42,200 | $0 | $0 |
| 2016 | $888 | $42,200 | $0 | $0 |
| 2015 | -- | $42,200 | $0 | $0 |
| 2014 | -- | $42,200 | $0 | $0 |
Source: Public Records
Map
Nearby Homes
- 237 E Camden Wyoming Ave
- 19 S Main St
- 111 Meeting House Ln
- 15 Wesley St
- 109 Wesley St
- 210 Cambridge Rd
- 110 W Camden Wyoming Ave
- 705 Millet Ln
- 118 Broad St
- 12191 Willow Grove Rd
- 30 Wingate Ct N
- 200 N Mechanic St
- 374 David Hall Rd
- 1552 John Clark Rd
- 16 Lone Tree Dr
- 11939 Willow Grove Rd
- 103 Osprey Ct
- 1573 Nathaniel Mitchell Rd
- 111 Downey Oak Cir
- 58 Downey Oak Cir