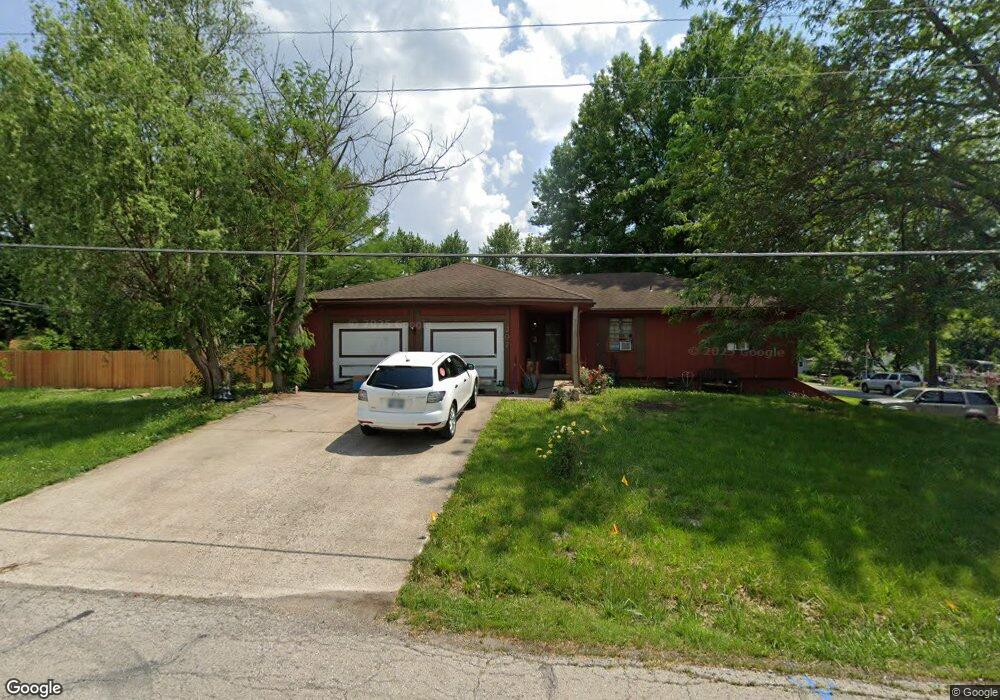
207 W Allen St Spring Hill, KS 66083
Estimated Value: $289,000 - $318,000
4
Beds
3
Baths
1,672
Sq Ft
$185/Sq Ft
Est. Value
About This Home
This home is located at 207 W Allen St, Spring Hill, KS 66083 and is currently estimated at $309,843, approximately $185 per square foot. 207 W Allen St is a home located in Johnson County with nearby schools including Spring Hill Elementary School, Spring Hill Middle School, and Spring Hill High School.
Ownership History
Date
Name
Owned For
Owner Type
Purchase Details
Closed on
Aug 17, 2007
Sold by
Hsbc Bank Usa N A
Bought by
Langdon Angela
Current Estimated Value
Home Financials for this Owner
Home Financials are based on the most recent Mortgage that was taken out on this home.
Original Mortgage
$112,575
Outstanding Balance
$71,495
Interest Rate
6.72%
Mortgage Type
New Conventional
Estimated Equity
$238,348
Purchase Details
Closed on
Feb 13, 2007
Sold by
Gray Daniel L and Gray Crystal R
Bought by
Hsbc Bank Usa Na
Purchase Details
Closed on
Mar 25, 2005
Sold by
Williams Cathleen C
Bought by
Gray Daniel L and Gray Crystal R
Home Financials for this Owner
Home Financials are based on the most recent Mortgage that was taken out on this home.
Original Mortgage
$29,100
Interest Rate
5.71%
Mortgage Type
Stand Alone Second
Create a Home Valuation Report for This Property
The Home Valuation Report is an in-depth analysis detailing your home's value as well as a comparison with similar homes in the area
Home Values in the Area
Average Home Value in this Area
Purchase History
| Date | Buyer | Sale Price | Title Company |
|---|---|---|---|
| Langdon Angela | -- | Mokan Title Services | |
| Hsbc Bank Usa Na | $127,254 | None Available | |
| Gray Daniel L | -- | Coffelt Land Title Inc |
Source: Public Records
Mortgage History
| Date | Status | Borrower | Loan Amount |
|---|---|---|---|
| Open | Langdon Angela | $112,575 | |
| Previous Owner | Gray Daniel L | $29,100 | |
| Previous Owner | Gray Daniel L | $116,400 |
Source: Public Records
Tax History Compared to Growth
Tax History
| Year | Tax Paid | Tax Assessment Tax Assessment Total Assessment is a certain percentage of the fair market value that is determined by local assessors to be the total taxable value of land and additions on the property. | Land | Improvement |
|---|---|---|---|---|
| 2024 | $4,121 | $29,923 | $5,050 | $24,873 |
| 2023 | $3,469 | $25,335 | $5,050 | $20,285 |
| 2022 | $3,349 | $24,380 | $4,592 | $19,788 |
| 2021 | $3,014 | $21,390 | $3,673 | $17,717 |
| 2020 | $2,911 | $20,102 | $3,336 | $16,766 |
| 2019 | $2,818 | $19,447 | $2,904 | $16,543 |
| 2018 | $2,534 | $18,067 | $2,904 | $15,163 |
| 2017 | $2,299 | $16,273 | $2,904 | $13,369 |
| 2016 | $2,023 | $14,421 | $2,904 | $11,517 |
| 2015 | $1,964 | $13,996 | $2,904 | $11,092 |
| 2013 | -- | $13,237 | $2,904 | $10,333 |
Source: Public Records
Map
Nearby Homes
- 807 N Webster St
- 404 N Washington St
- 108 W Lawrence St
- 509 W Smith St
- 513 W Smith St
- 511 W Smith St
- 515 W Smith St
- 501 N Franklin St
- 510 W Smith St
- 508 W Lawrence Ave
- 512 W Lawrence Ave
- 204 N Madison St
- 514 W Lawrence Ave
- 0 St Unit HMS2525363
- 109 N Harrison St
- 308 E Nichols St
- 303 S Jackson St
- 21004 Millridge St
- 21141 Millridge St
- 0 169 Hwy Unit HMS2507540
- 206 W Allen St
- 201 W Allen St
- 607 N Madison St
- 602 N Jefferson St
- 609 N Jefferson St
- 202 W Allen St
- 607 N Jefferson St
- 603 N Madison St
- 601 N Jefferson St
- 704 N Jefferson St
- 303 W Allen St
- 108 W Allen St
- 507 N Madison St
- 608 N Madison St
- 509 N Jefferson St
- 606 N Madison St
- 508 N Jefferson St
- 612 N Washington St
- 604 N Madison St
- 602 N Madison St