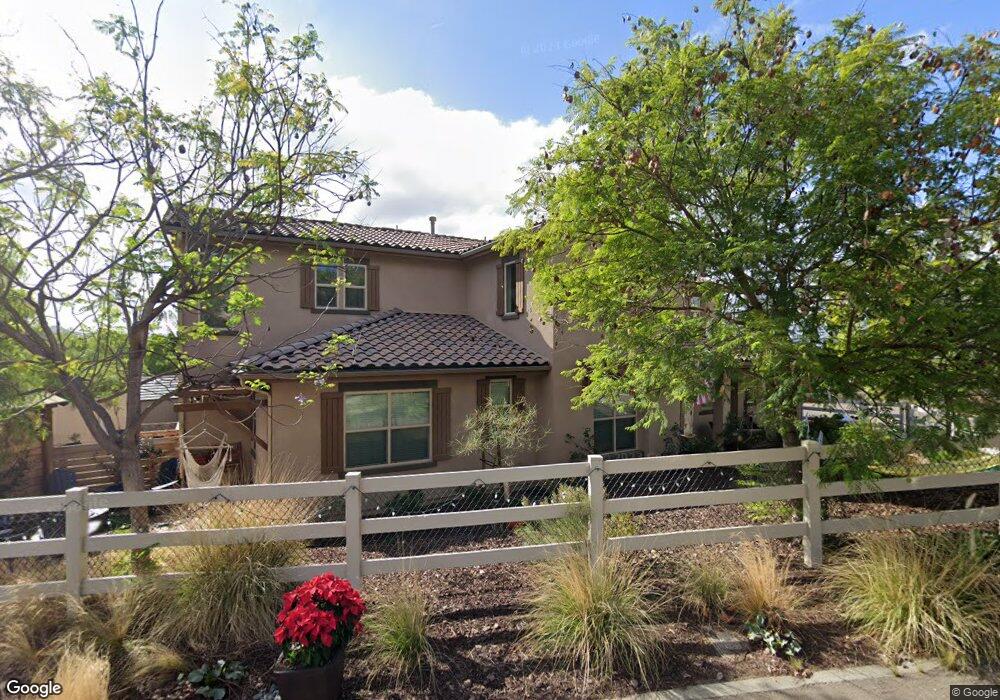
2071 Ingamac Way El Cajon, CA 92019
Granite Hills NeighborhoodEstimated Value: $1,245,000 - $1,592,000
4
Beds
4
Baths
3,271
Sq Ft
$430/Sq Ft
Est. Value
About This Home
This home is located at 2071 Ingamac Way, El Cajon, CA 92019 and is currently estimated at $1,407,502, approximately $430 per square foot. 2071 Ingamac Way is a home located in San Diego County with nearby schools including Madison Avenue Elementary School, Montgomery Middle School, and Granite Hills High School.
Ownership History
Date
Name
Owned For
Owner Type
Purchase Details
Closed on
Dec 30, 2016
Sold by
New Pointe Investment 30 Llc
Bought by
Ramos Pedro R and Hetzel Ramos Casey L
Current Estimated Value
Home Financials for this Owner
Home Financials are based on the most recent Mortgage that was taken out on this home.
Original Mortgage
$636,000
Outstanding Balance
$522,770
Interest Rate
4.03%
Mortgage Type
New Conventional
Estimated Equity
$884,732
Purchase Details
Closed on
Jun 22, 2015
Sold by
Rmo Greenfield Estate Llc
Bought by
New Pointe Investment 30 Llc
Purchase Details
Closed on
Oct 21, 2014
Sold by
Lemcke Hans and Lemcke Maria
Bought by
Rmo Greenfield Estates Llc
Purchase Details
Closed on
Sep 11, 2014
Sold by
Prism Development Llc
Bought by
Lemcke Hans and Lemcke Maria
Purchase Details
Closed on
Dec 24, 2012
Sold by
Wells Fargo Bank National Association
Bought by
Prism Development Company Llc
Home Financials for this Owner
Home Financials are based on the most recent Mortgage that was taken out on this home.
Original Mortgage
$650,000
Interest Rate
3.27%
Mortgage Type
Purchase Money Mortgage
Purchase Details
Closed on
Sep 16, 2010
Sold by
Rockhaven Development Inc
Bought by
Wells Fargo Bank Na
Purchase Details
Closed on
Mar 27, 2003
Sold by
Avr Builders Inc
Bought by
Cisneros Cresencio and Cisneros Enrique
Home Financials for this Owner
Home Financials are based on the most recent Mortgage that was taken out on this home.
Original Mortgage
$279,000
Interest Rate
5.79%
Purchase Details
Closed on
Aug 11, 2000
Sold by
Bajwaber Knulud S S
Bought by
Al Mahmodi Mnshed N
Home Financials for this Owner
Home Financials are based on the most recent Mortgage that was taken out on this home.
Original Mortgage
$727,000
Interest Rate
8.11%
Purchase Details
Closed on
Jul 25, 1997
Sold by
Daugherty Jessie E and Daugherty James R
Bought by
Wright Stanley P and Wright Rebecca J
Purchase Details
Closed on
Jul 21, 1997
Sold by
P & E Development Inc
Bought by
Priest Daryl R and Priest Cynthia L
Purchase Details
Closed on
Dec 13, 1996
Sold by
Zimmerman G C G and Zimmerman Bernyce A
Bought by
Priest Daryl R and Priest Cynthia L
Home Financials for this Owner
Home Financials are based on the most recent Mortgage that was taken out on this home.
Original Mortgage
$57,500
Interest Rate
7.59%
Mortgage Type
Seller Take Back
Create a Home Valuation Report for This Property
The Home Valuation Report is an in-depth analysis detailing your home's value as well as a comparison with similar homes in the area
Home Values in the Area
Average Home Value in this Area
Purchase History
| Date | Buyer | Sale Price | Title Company |
|---|---|---|---|
| Ramos Pedro R | $795,000 | First American Title Company | |
| New Pointe Investment 30 Llc | $1,680,000 | Chicago Title Company | |
| Rmo Greenfield Estates Llc | $800,000 | Chicago Title Company | |
| Lemcke Hans | $136,000 | Wfg National | |
| Prism Development Company Llc | $1,000,000 | First American Title Insuran | |
| Wells Fargo Bank Na | $728,517 | Accommodation | |
| Cisneros Cresencio | $310,000 | First American Title Co | |
| Al Mahmodi Mnshed N | -- | Commonwealth Land Title Co | |
| Al Mahmodi Mnshed N | $1,125,000 | Commonwealth Land Title Co | |
| Wright Stanley P | $600 | -- | |
| Priest Daryl R | -- | -- | |
| Priest Daryl R | $115,000 | -- |
Source: Public Records
Mortgage History
| Date | Status | Borrower | Loan Amount |
|---|---|---|---|
| Open | Ramos Pedro R | $636,000 | |
| Previous Owner | Prism Development Company Llc | $650,000 | |
| Previous Owner | Cisneros Cresencio | $279,000 | |
| Previous Owner | Al Mahmodi Mnshed N | $727,000 | |
| Previous Owner | Priest Daryl R | $57,500 | |
| Closed | Al Mahmodi Mnshed N | $56,250 |
Source: Public Records
Tax History Compared to Growth
Tax History
| Year | Tax Paid | Tax Assessment Tax Assessment Total Assessment is a certain percentage of the fair market value that is determined by local assessors to be the total taxable value of land and additions on the property. | Land | Improvement |
|---|---|---|---|---|
| 2025 | $11,665 | $922,660 | $313,355 | $609,305 |
| 2024 | $11,665 | $904,569 | $307,211 | $597,358 |
| 2023 | $11,286 | $886,834 | $301,188 | $585,646 |
| 2022 | $11,058 | $869,446 | $295,283 | $574,163 |
| 2021 | $10,948 | $852,399 | $289,494 | $562,905 |
| 2020 | $10,833 | $843,660 | $286,526 | $557,134 |
| 2019 | $10,004 | $827,118 | $280,908 | $546,210 |
| 2018 | $9,840 | $810,900 | $275,400 | $535,500 |
| 2017 | $9,975 | $810,155 | $289,955 | $520,200 |
| 2016 | $5,851 | $484,270 | $284,270 | $200,000 |
| 2015 | $1,968 | $160,000 | $160,000 | $0 |
| 2014 | -- | $140,635 | $140,635 | $0 |
Source: Public Records
Map
Nearby Homes
- 2044 Eula Ln
- 0 Vista Valley Rim Place Unit 180055692
- 2155 Vista Valley Rim Place
- 330 Vista Del Escuela
- 1961 Forester Creek Rd
- 2060 Forester Creek Rd
- 497 Vista Del Escuela
- 1870 Euclid Ave Unit 1870
- 2297 1/2 Orchard Ave
- 2103 Sunnyside Ave
- 2202 Via Verde
- 1885 Euclid Ave
- 0 Quicker Rd Unit 250029645
- 1170 Via Loma Vista
- 1138 Via Loma Vista
- 1772 Greenfield Ct
- 1319 Yannis Ct
- 2162 Shire Dr
- 647 Crest Dr
- 1935 Granite Hills Dr
- 2067 Ingamac Way
- 2085 Ingamac Way
- 2078 Ingamac Way
- 2067 Valley Rim Rd
- 2062 Ingamac Way
- 2095 Valley Rim Rd
- 2056 Valley Rim Rd
- 2093 Ingamac Way
- 1992 E Madison Ave
- 2058 Ingamac Way
- 2096 Ingamac Way
- 1986 E Madison Ave
- 1980 E Madison Ave
- 2060 Valley Rim Rd
- 1952 E Madison Ave
- 2050 Greenfield Dr
- 2014 E Madison Ave
- 2054 E Madison Ave Unit A
- 2054 E Madison Ave
- 0 Ingamac Way