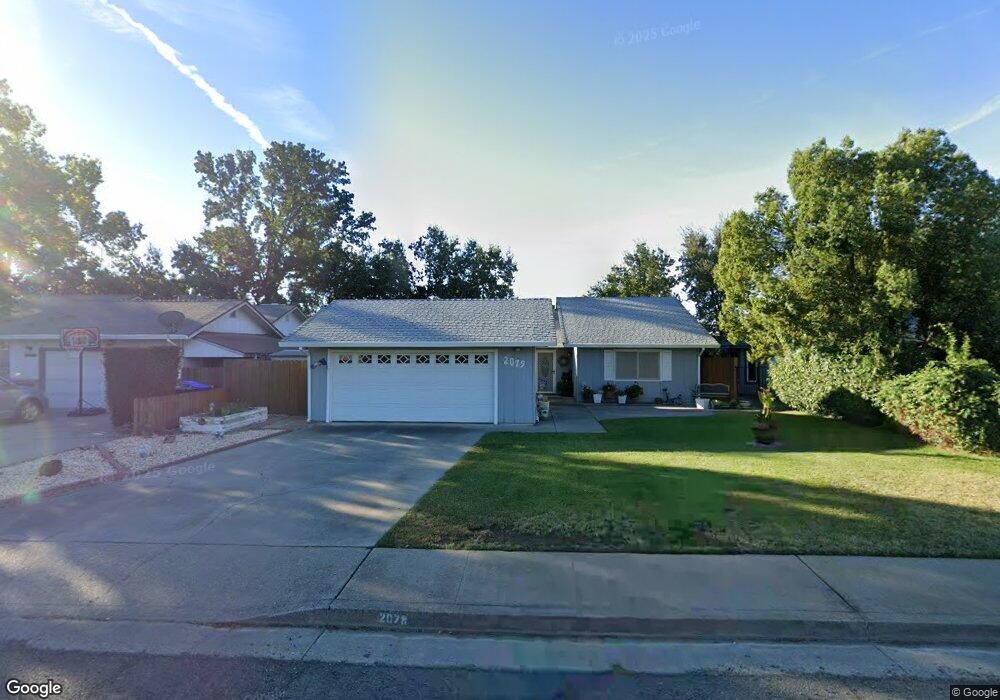
2079 Stonybrook Dr Red Bluff, CA 96080
Estimated Value: $315,469 - $339,000
3
Beds
2
Baths
1,353
Sq Ft
$242/Sq Ft
Est. Value
About This Home
This home is located at 2079 Stonybrook Dr, Red Bluff, CA 96080 and is currently estimated at $327,617, approximately $242 per square foot. 2079 Stonybrook Dr is a home located in Tehama County with nearby schools including Bidwell Elementary School, Vista Preparatory Academy, and Red Bluff High School.
Ownership History
Date
Name
Owned For
Owner Type
Purchase Details
Closed on
Sep 11, 2024
Sold by
Morris Jacqueline E
Bought by
Morris Jacqueline E and Gomez David Joseph
Current Estimated Value
Purchase Details
Closed on
Aug 12, 2022
Sold by
Morris Family Trust
Bought by
Morris Jacqueline E
Purchase Details
Closed on
Jun 23, 2022
Sold by
Morris Jacqueline E
Bought by
Morris Jacqueline E
Purchase Details
Closed on
Apr 25, 2022
Sold by
Morris Jacqueline E
Bought by
Morris Jacqueline E and Gomez David J
Purchase Details
Closed on
Jun 29, 2017
Sold by
Morris Jacqueline E
Bought by
Morris Jacqueline E
Purchase Details
Closed on
Sep 16, 2005
Sold by
Lingenfelter Alan L and Lingenfelter Sandra L
Bought by
Morris Herbert M and Morris Jacqueline E
Home Financials for this Owner
Home Financials are based on the most recent Mortgage that was taken out on this home.
Original Mortgage
$25,990
Interest Rate
5.32%
Mortgage Type
Unknown
Create a Home Valuation Report for This Property
The Home Valuation Report is an in-depth analysis detailing your home's value as well as a comparison with similar homes in the area
Purchase History
| Date | Buyer | Sale Price | Title Company |
|---|---|---|---|
| Morris Jacqueline E | -- | None Listed On Document | |
| Morris Jacqueline E | -- | None Listed On Document | |
| Morris Jacqueline E | -- | None Listed On Document | |
| Morris Jacqueline E | -- | None Listed On Document | |
| Morris Jacqueline E | -- | None Available | |
| Morris Herbert M | $260,000 | Fidelity National Title |
Source: Public Records
Mortgage History
| Date | Status | Borrower | Loan Amount |
|---|---|---|---|
| Previous Owner | Morris Herbert M | $25,990 | |
| Previous Owner | Morris Herbert M | $207,920 |
Source: Public Records
Tax History
| Year | Tax Paid | Tax Assessment Tax Assessment Total Assessment is a certain percentage of the fair market value that is determined by local assessors to be the total taxable value of land and additions on the property. | Land | Improvement |
|---|---|---|---|---|
| 2025 | $2,753 | $265,650 | $79,695 | $185,955 |
| 2023 | $2,761 | $265,650 | $79,695 | $185,955 |
| 2022 | $2,723 | $265,650 | $79,695 | $185,955 |
| 2021 | $2,418 | $241,500 | $72,450 | $169,050 |
| 2020 | $2,160 | $210,000 | $63,000 | $147,000 |
| 2019 | $2,108 | $200,000 | $60,000 | $140,000 |
| 2018 | $1,765 | $178,259 | $68,587 | $109,672 |
| 2017 | $1,645 | $162,054 | $62,352 | $99,702 |
| 2016 | $1,489 | $154,337 | $59,383 | $94,954 |
| 2015 | -- | $154,337 | $59,383 | $94,954 |
| 2014 | $1,293 | $134,207 | $51,638 | $82,569 |
Source: Public Records
Map
Nearby Homes
- 329 Michael Dr
- 2030 Pebblestone Dr
- 550 Bayles Ave
- 675 Larie Ln
- 685 Larie Ln
- 1645 Aloha St
- 1480 Leonard Ln
- 1455 Acacia St
- 1560 Carl Ct
- 1402 Scottsdale Way
- 1235 Britt Ln
- 1307 Deborah Dr
- 1270 Aloha St
- 1160 Orange St
- 1210 Wetter Way
- 1835 Douglass St
- 1570 Douglass St
- 845 Olive St
- 1707 Luning St
- 821 Locust St
- 2075 Stonybrook Dr
- 2083 Stonybrook Dr
- 2085 Stonybrook Dr
- 2069 Stonybrook Dr
- 310 Michael Dr
- 319 Michael Dr
- 2065 Stonybrook Dr
- 2070 Stonybrook Dr
- 320 Michael Dr
- 2093 Stonybrook Dr
- 310 Christina Dr
- 2068 Stonybrook Dr
- 340 Michael Dr
- 320 Christina Dr
- 339 Michael Dr
- 2055 Stonybrook Dr
- 2095 Stonybrook Dr
- 2066 Stonybrook Dr
- 350 Michael Dr
- 340 Christina Dr
Your Personal Tour Guide
Ask me questions while you tour the home.