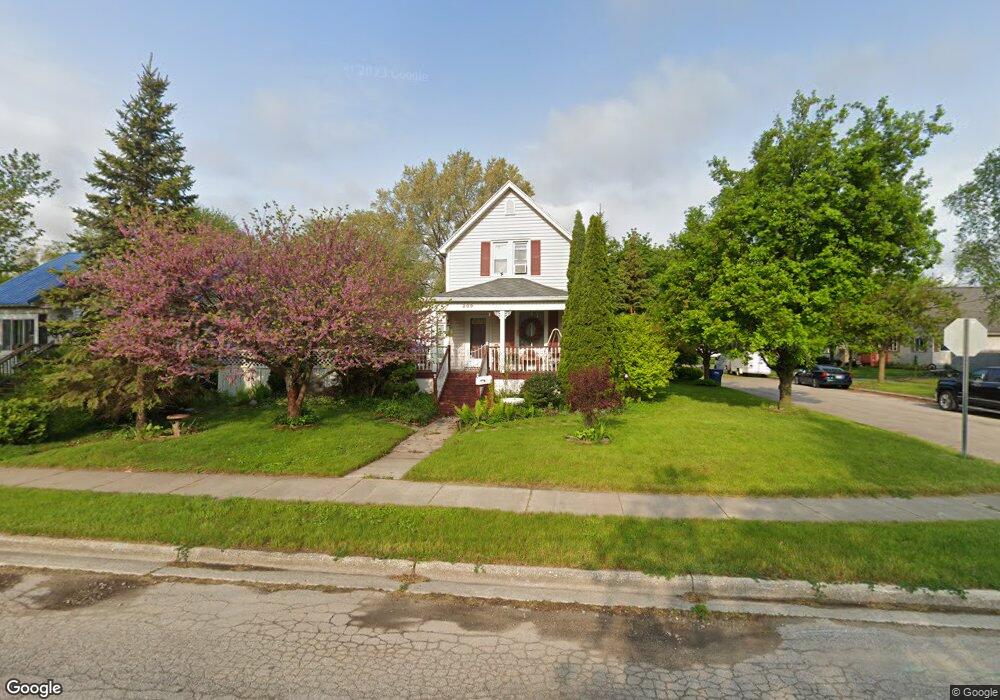
209 Keystone St Bay City, MI 48706
Estimated Value: $94,000 - $129,000
3
Beds
1
Bath
1,356
Sq Ft
$83/Sq Ft
Est. Value
About This Home
This home is located at 209 Keystone St, Bay City, MI 48706 and is currently estimated at $113,099, approximately $83 per square foot. 209 Keystone St is a home located in Bay County with nearby schools including Linsday Elementary School, Handy Middle School, and Bay City Central High School.
Ownership History
Date
Name
Owned For
Owner Type
Purchase Details
Closed on
Nov 9, 2006
Sold by
Goulette Harth A and Goulette Royal G
Bought by
Valeck James J and Valeck Marcia B
Current Estimated Value
Home Financials for this Owner
Home Financials are based on the most recent Mortgage that was taken out on this home.
Original Mortgage
$75,000
Outstanding Balance
$44,786
Interest Rate
6.38%
Mortgage Type
Purchase Money Mortgage
Estimated Equity
$68,313
Purchase Details
Closed on
Feb 15, 2002
Sold by
Lyman Roger J
Bought by
Goulette Harth A
Create a Home Valuation Report for This Property
The Home Valuation Report is an in-depth analysis detailing your home's value as well as a comparison with similar homes in the area
Home Values in the Area
Average Home Value in this Area
Purchase History
| Date | Buyer | Sale Price | Title Company |
|---|---|---|---|
| Valeck James J | $79,900 | None Available | |
| Goulette Harth A | $79,400 | -- |
Source: Public Records
Mortgage History
| Date | Status | Borrower | Loan Amount |
|---|---|---|---|
| Open | Valeck James J | $75,000 |
Source: Public Records
Tax History Compared to Growth
Tax History
| Year | Tax Paid | Tax Assessment Tax Assessment Total Assessment is a certain percentage of the fair market value that is determined by local assessors to be the total taxable value of land and additions on the property. | Land | Improvement |
|---|---|---|---|---|
| 2025 | $1,155 | $47,150 | $0 | $0 |
| 2024 | $951 | $41,850 | $0 | $0 |
| 2023 | $905 | $35,900 | $0 | $0 |
| 2022 | $1,040 | $32,500 | $0 | $0 |
| 2021 | $978 | $30,600 | $30,600 | $0 |
| 2020 | $1,040 | $23,200 | $23,200 | $0 |
| 2019 | $1,017 | $21,150 | $0 | $0 |
| 2018 | $1,007 | $20,500 | $0 | $0 |
| 2017 | $1,028 | $20,950 | $0 | $0 |
| 2016 | $1,024 | $20,800 | $0 | $20,800 |
| 2015 | $1,087 | $23,350 | $0 | $23,350 |
| 2014 | $1,087 | $22,300 | $0 | $22,300 |
Source: Public Records
Map
Nearby Homes