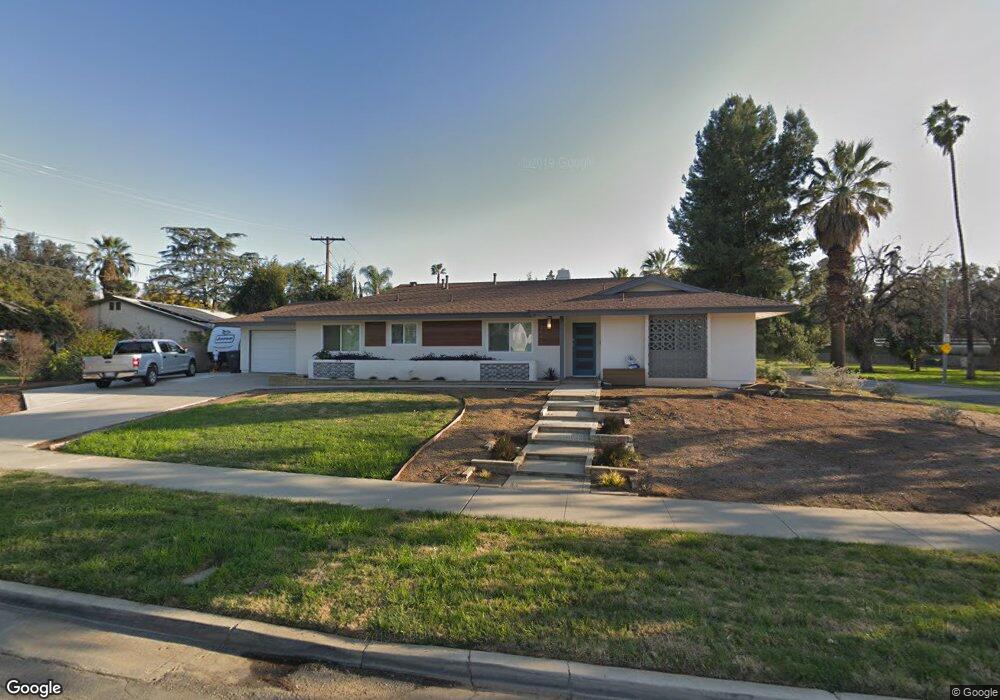
2090 Benedict Ave Riverside, CA 92506
Victoria NeighborhoodEstimated Value: $645,499 - $727,000
3
Beds
2
Baths
1,561
Sq Ft
$447/Sq Ft
Est. Value
About This Home
This home is located at 2090 Benedict Ave, Riverside, CA 92506 and is currently estimated at $697,125, approximately $446 per square foot. 2090 Benedict Ave is a home located in Riverside County with nearby schools including Alcott Elementary School, Matthew Gage Middle School, and Polytechnic High School.
Ownership History
Date
Name
Owned For
Owner Type
Purchase Details
Closed on
Nov 15, 2017
Sold by
Msc Development Inc
Bought by
Shourds Shawn F and Shourds Yvette M
Current Estimated Value
Home Financials for this Owner
Home Financials are based on the most recent Mortgage that was taken out on this home.
Original Mortgage
$413,054
Interest Rate
4.87%
Mortgage Type
FHA
Purchase Details
Closed on
Jun 8, 2017
Sold by
Stewart Jamie
Bought by
Msc Development Inc
Home Financials for this Owner
Home Financials are based on the most recent Mortgage that was taken out on this home.
Original Mortgage
$220,000
Interest Rate
4.02%
Mortgage Type
Purchase Money Mortgage
Purchase Details
Closed on
Feb 10, 2011
Sold by
Nelson Barbara Jean
Bought by
Stewart Jamie
Create a Home Valuation Report for This Property
The Home Valuation Report is an in-depth analysis detailing your home's value as well as a comparison with similar homes in the area
Home Values in the Area
Average Home Value in this Area
Purchase History
| Date | Buyer | Sale Price | Title Company |
|---|---|---|---|
| Shourds Shawn F | $435,000 | Ticor Title | |
| Msc Development Inc | $297,000 | Stewart Title Of California | |
| Stewart Jamie | -- | None Available |
Source: Public Records
Mortgage History
| Date | Status | Borrower | Loan Amount |
|---|---|---|---|
| Previous Owner | Shourds Shawn F | $413,054 | |
| Previous Owner | Msc Development Inc | $220,000 |
Source: Public Records
Tax History
| Year | Tax Paid | Tax Assessment Tax Assessment Total Assessment is a certain percentage of the fair market value that is determined by local assessors to be the total taxable value of land and additions on the property. | Land | Improvement |
|---|---|---|---|---|
| 2025 | $5,377 | $494,952 | $102,402 | $392,550 |
| 2023 | $5,377 | $475,734 | $98,427 | $377,307 |
| 2022 | $5,255 | $466,407 | $96,498 | $369,909 |
| 2021 | $5,184 | $457,262 | $94,606 | $362,656 |
| 2020 | $5,145 | $452,574 | $93,636 | $358,938 |
| 2019 | $5,049 | $443,700 | $91,800 | $351,900 |
| 2018 | $4,477 | $392,700 | $91,800 | $300,900 |
| 2017 | $4,379 | $373,474 | $158,443 | $215,031 |
| 2016 | $3,995 | $366,152 | $155,337 | $210,815 |
| 2015 | $3,824 | $350,000 | $148,000 | $202,000 |
| 2014 | $3,549 | $321,000 | $136,000 | $185,000 |
Source: Public Records
Map
Nearby Homes
- 2130 Old Quarry Rd
- 2160 Falcon Crest Dr
- 5821 Sunset Ranch Dr
- 2078 Livingston St
- 2188 Ranchwood Place
- 5540 Royal Hill Dr
- 2216 El Capitan Dr
- 6141 Bluffwood Dr
- 2252 El Capitan Dr
- 2111 Elsinore Rd
- 2424 Central Ave
- 1450 Via Vallarta
- 2111 Whitestone Dr
- 6090 Promontory Ln
- 6140 Windemere Way
- 1750 Century Ave
- 5978 Copperfield Ave
- 5979 Copperfield Ave
- 6180 Shaker Dr
- 5404 Quince St
- 5722 Glenhaven Ct Unit 1
- 5717 Argyle Way
- 2091 Benedict Ave
- 5683 Argyle Way
- 5731 Argyle Way
- 5738 Glenhaven Ct
- 5695 Glenhaven Ave
- 5690 Argyle Way
- 5668 Glenhaven Ave
- 2046 Benedict Ave
- 5743 Argyle Way
- 5659 Argyle Way
- 5750 Glenhaven Ct
- 2027 Benedict Ave
- 5670 Argyle Way
- 5650 Glenhaven Ave
- 5738 Argyle Way
- 5668 Queen Palms Dr
- 2114 Oak Crest Dr
- 2102 Oak Crest Dr
Your Personal Tour Guide
Ask me questions while you tour the home.