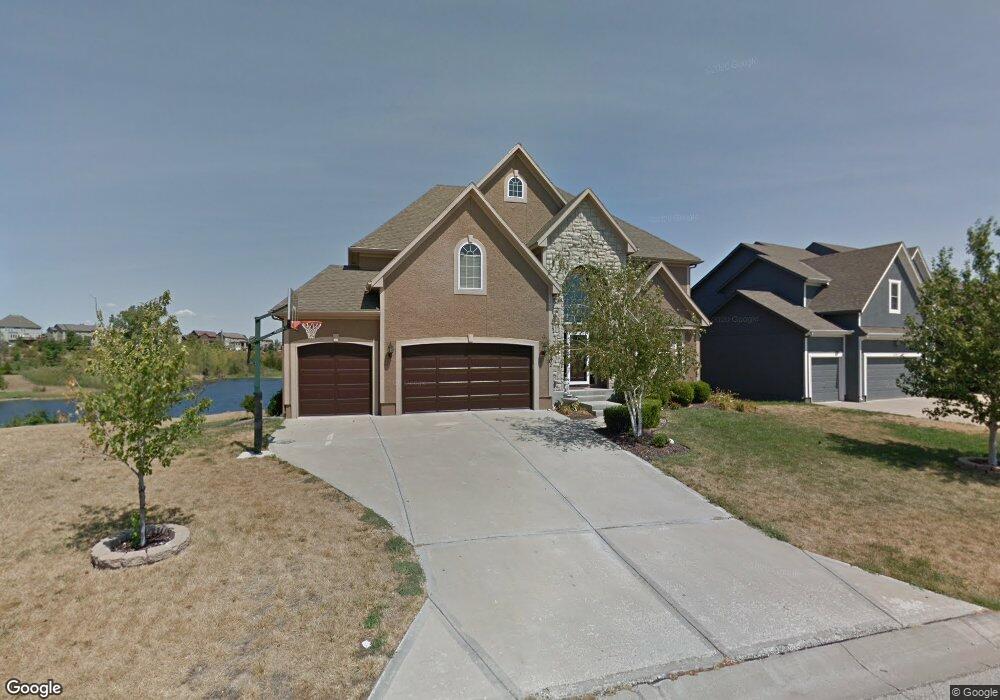
20902 W 58th St Shawnee, KS 66218
Estimated Value: $597,000 - $679,000
6
Beds
5
Baths
3,336
Sq Ft
$190/Sq Ft
Est. Value
About This Home
This home is located at 20902 W 58th St, Shawnee, KS 66218 and is currently estimated at $635,358, approximately $190 per square foot. 20902 W 58th St is a home located in Johnson County with nearby schools including Clear Creek Elementary School, Monticello Trails Middle School, and Mill Valley High School.
Ownership History
Date
Name
Owned For
Owner Type
Purchase Details
Closed on
Jul 16, 2010
Sold by
Felshaw David E and Felshaw Suzanne R
Bought by
Felshaw David E and Felshaw Suzanne R
Current Estimated Value
Purchase Details
Closed on
Oct 10, 2003
Sold by
J Right Inc
Bought by
Felshaw David E and Felshaw Suzanne R
Home Financials for this Owner
Home Financials are based on the most recent Mortgage that was taken out on this home.
Original Mortgage
$246,537
Outstanding Balance
$113,072
Interest Rate
5.96%
Mortgage Type
Stand Alone Second
Estimated Equity
$522,286
Purchase Details
Closed on
Apr 2, 2003
Sold by
Lakepointe Developers Inc
Bought by
J Right Inc
Home Financials for this Owner
Home Financials are based on the most recent Mortgage that was taken out on this home.
Original Mortgage
$249,600
Interest Rate
5.77%
Create a Home Valuation Report for This Property
The Home Valuation Report is an in-depth analysis detailing your home's value as well as a comparison with similar homes in the area
Home Values in the Area
Average Home Value in this Area
Purchase History
| Date | Buyer | Sale Price | Title Company |
|---|---|---|---|
| Felshaw David E | -- | None Available | |
| Felshaw David E | -- | Security Land Title Company | |
| J Right Inc | -- | Security Land Title Company |
Source: Public Records
Mortgage History
| Date | Status | Borrower | Loan Amount |
|---|---|---|---|
| Open | Felshaw David E | $246,537 | |
| Previous Owner | J Right Inc | $249,600 |
Source: Public Records
Tax History Compared to Growth
Tax History
| Year | Tax Paid | Tax Assessment Tax Assessment Total Assessment is a certain percentage of the fair market value that is determined by local assessors to be the total taxable value of land and additions on the property. | Land | Improvement |
|---|---|---|---|---|
| 2024 | $7,963 | $68,126 | $15,955 | $52,171 |
| 2023 | $8,171 | $69,391 | $15,955 | $53,436 |
| 2022 | $7,491 | $62,342 | $13,874 | $48,468 |
| 2021 | $7,071 | $56,730 | $12,603 | $44,127 |
| 2020 | $6,778 | $53,889 | $12,603 | $41,286 |
| 2019 | $6,863 | $53,774 | $11,464 | $42,310 |
| 2018 | $6,465 | $50,197 | $11,464 | $38,733 |
| 2017 | $6,597 | $49,979 | $10,412 | $39,567 |
| 2016 | $6,556 | $49,059 | $9,921 | $39,138 |
| 2015 | $6,484 | $47,541 | $9,921 | $37,620 |
| 2013 | -- | $44,378 | $9,921 | $34,457 |
Source: Public Records
Map
Nearby Homes
- 5817 Millbrook St
- 5725 Marion St
- 5900 Redbud St
- 21309 W 56th St
- 21315 W 56th St
- 21217 W 55th Terrace
- 6046 Redbud St
- 6031 Lakecrest Dr
- 5405 Lakecrest Dr
- 5311 Brownridge Dr
- 6246 Woodland Dr
- 21609 W 61st St
- 5307 Noble St
- 21624 W 53rd Terrace
- 58.14 acres Woodland Dr
- 31.24 Acres of Woodland Dr
- 46.13 Acres of Woodland Dr
- 22209 W 57th St
- 21804 W 52nd Terrace
- 22310 W 58th St
- 20810 W 58th St
- 20806 W 58th St
- 20910 W 58th St
- 20901 W 58th St
- 20905 W 58th St
- 5801 Woodstock St
- 20802 W 58th St
- 20909 W 58th St
- 20914 W 58th St
- 5805 Woodstock St
- 5810 Woodstock St
- 5800 Millbrook St
- 20913 W 58th St
- 20716 W 58th St
- 21004 W 58th St
- 5809 Woodstock St
- 5808 Millbrook St
- 21003 W 58th St
- 20712 W 58th St
- 5814 Woodstock St