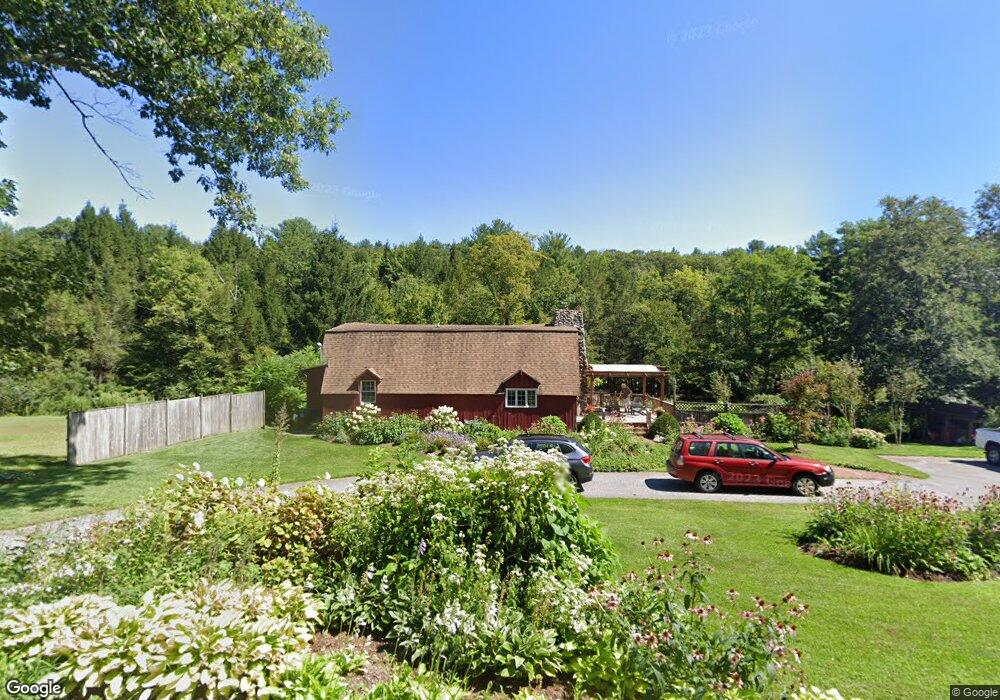
2092 Newfield Rd Torrington, CT 06790
Estimated Value: $300,000 - $427,000
3
Beds
2
Baths
2,278
Sq Ft
$155/Sq Ft
Est. Value
About This Home
This home is located at 2092 Newfield Rd, Torrington, CT 06790 and is currently estimated at $352,464, approximately $154 per square foot. 2092 Newfield Rd is a home located in Litchfield County with nearby schools including Torrington Middle School, Torrington High School, and St. John Paul the Great Academy.
Ownership History
Date
Name
Owned For
Owner Type
Purchase Details
Closed on
Dec 16, 1997
Sold by
Weinstein Richard P
Bought by
Carrier Gregory J and Carrier Marlene G
Current Estimated Value
Purchase Details
Closed on
Aug 3, 1994
Sold by
Re Inv Co
Bought by
Ammerman Thomas W and Ammerman Karen L
Create a Home Valuation Report for This Property
The Home Valuation Report is an in-depth analysis detailing your home's value as well as a comparison with similar homes in the area
Home Values in the Area
Average Home Value in this Area
Purchase History
| Date | Buyer | Sale Price | Title Company |
|---|---|---|---|
| Carrier Gregory J | $43,000 | -- | |
| Ammerman Thomas W | $83,200 | -- | |
| Carrier Gregory J | $43,000 | -- | |
| Ammerman Thomas W | $83,200 | -- |
Source: Public Records
Mortgage History
| Date | Status | Borrower | Loan Amount |
|---|---|---|---|
| Open | Ammerman Thomas W | $144,000 | |
| Closed | Ammerman Thomas W | $120,000 | |
| Closed | Ammerman Thomas W | $114,200 |
Source: Public Records
Tax History Compared to Growth
Tax History
| Year | Tax Paid | Tax Assessment Tax Assessment Total Assessment is a certain percentage of the fair market value that is determined by local assessors to be the total taxable value of land and additions on the property. | Land | Improvement |
|---|---|---|---|---|
| 2025 | $6,869 | $178,640 | $23,940 | $154,700 |
| 2024 | $5,324 | $110,980 | $23,980 | $87,000 |
| 2023 | $5,323 | $110,980 | $23,980 | $87,000 |
| 2022 | $5,232 | $110,980 | $23,980 | $87,000 |
| 2021 | $5,124 | $110,980 | $23,980 | $87,000 |
| 2020 | $5,124 | $110,980 | $23,980 | $87,000 |
| 2019 | $4,942 | $107,030 | $29,450 | $77,580 |
| 2018 | $4,942 | $107,030 | $29,450 | $77,580 |
| 2017 | $4,897 | $107,030 | $29,450 | $77,580 |
| 2016 | $4,897 | $107,030 | $29,450 | $77,580 |
| 2015 | $4,897 | $107,030 | $29,450 | $77,580 |
| 2014 | $4,297 | $118,310 | $43,400 | $74,910 |
Source: Public Records
Map
Nearby Homes
- 000 Newfield Rd
- 721 Marshall Lake Rd
- 0 Meyer Rd
- 197 Meyer Rd
- 274 Cliffside Dr Unit 274
- 617 Guerdat Rd
- 390 Trailsend Dr Unit 390
- 389 Trailsend Dr
- 239 Ledge Dr
- 225 Ledge Dr
- 174 Ledge Dr
- 250 Cliffside Dr
- 98 Woodside Cir
- 431 Trailsend Dr Unit + Garage G128
- 90 Woodside Cir
- 103 Woodside Cir
- 65 Woodside Cir Unit 65
- 207 Ledge Dr
- 1275 Winsted Rd Unit 101
- 469 Platt Hill Rd
- 0 Newfield Rd Unit L127978
- 0 Newfield Rd Unit L127976
- 2072 Newfield Rd
- 2104 Newfield Rd
- A Newfield Rd
- 2044 Newfield Rd
- 85 Saw Mill Hill Rd
- 69 Saw Mill Hill Rd
- 219 Saw Mill Hill Rd
- 3 Saw Mill Hill Rd
- 0 Marshall Lake Rd Unit L144576
- 0 Marshall Lake Rd Unit L147207
- 0 Marshall Lake Rd Unit 170433545
- 1 Marshall Lake Rd
- 0 Marshall Lake Rd Unit 170153305
- 6 Saw Mill Hill Rd
- 320 Marshall Lake Rd
- 155 Saw Mill Hill Rd
- 1949 Newfield Rd
- 151 Cardinal Cir