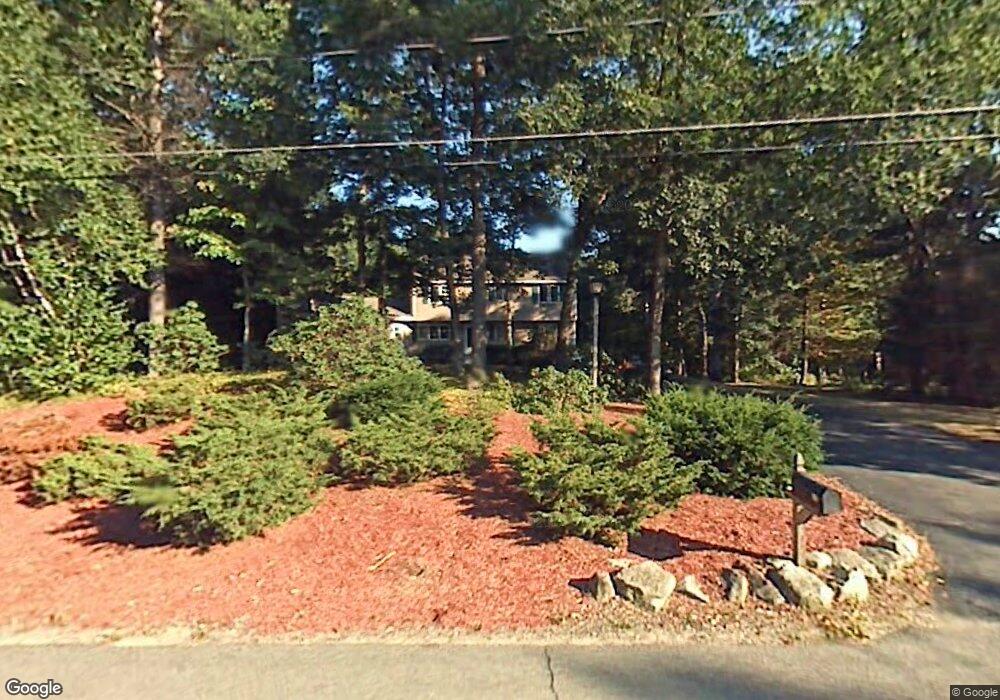
21 Brookside Terrace Atkinson, NH 03811
Estimated Value: $688,441 - $836,000
4
Beds
3
Baths
2,931
Sq Ft
$254/Sq Ft
Est. Value
About This Home
This home is located at 21 Brookside Terrace, Atkinson, NH 03811 and is currently estimated at $744,610, approximately $254 per square foot. 21 Brookside Terrace is a home located in Rockingham County with nearby schools including Atkinson Academy, Timberlane Regional Middle School, and Timberlane Regional High School.
Ownership History
Date
Name
Owned For
Owner Type
Purchase Details
Closed on
Feb 26, 2024
Sold by
Svenson Thomas C
Bought by
Ohio State T and Svenson
Current Estimated Value
Purchase Details
Closed on
Feb 11, 2013
Sold by
Svenson Thomas C and Murrell Marianne N
Bought by
Svenson Thomas C
Home Financials for this Owner
Home Financials are based on the most recent Mortgage that was taken out on this home.
Original Mortgage
$294,400
Interest Rate
3.38%
Mortgage Type
New Conventional
Purchase Details
Closed on
May 30, 2007
Sold by
Perkins Sean T and Perkins Elizabeth A
Bought by
Svenson Thomas C
Home Financials for this Owner
Home Financials are based on the most recent Mortgage that was taken out on this home.
Original Mortgage
$254,000
Interest Rate
6.24%
Mortgage Type
Purchase Money Mortgage
Create a Home Valuation Report for This Property
The Home Valuation Report is an in-depth analysis detailing your home's value as well as a comparison with similar homes in the area
Home Values in the Area
Average Home Value in this Area
Purchase History
| Date | Buyer | Sale Price | Title Company |
|---|---|---|---|
| Ohio State T | -- | None Available | |
| Svenson Thomas C | -- | -- | |
| Svenson Thomas C | $389,900 | -- |
Source: Public Records
Mortgage History
| Date | Status | Borrower | Loan Amount |
|---|---|---|---|
| Previous Owner | Svenson Thomas C | $294,400 | |
| Previous Owner | Svenson Thomas C | $47,000 | |
| Previous Owner | Svenson Thomas C | $245,148 | |
| Previous Owner | Svenson Thomas C | $254,000 | |
| Previous Owner | Svenson Thomas C | $70,000 |
Source: Public Records
Tax History Compared to Growth
Tax History
| Year | Tax Paid | Tax Assessment Tax Assessment Total Assessment is a certain percentage of the fair market value that is determined by local assessors to be the total taxable value of land and additions on the property. | Land | Improvement |
|---|---|---|---|---|
| 2024 | $7,053 | $545,900 | $248,500 | $297,400 |
| 2023 | $7,916 | $545,900 | $248,500 | $297,400 |
| 2022 | $6,698 | $545,900 | $248,500 | $297,400 |
| 2021 | $6,747 | $545,900 | $248,500 | $297,400 |
| 2020 | $6,815 | $371,600 | $165,700 | $205,900 |
| 2019 | $6,566 | $371,600 | $165,700 | $205,900 |
| 2018 | $6,663 | $371,600 | $165,700 | $205,900 |
| 2017 | $6,800 | $371,600 | $165,700 | $205,900 |
| 2016 | $6,644 | $371,600 | $165,700 | $205,900 |
| 2015 | $6,622 | $346,700 | $160,200 | $186,500 |
| 2014 | $5,827 | $305,100 | $121,100 | $184,000 |
| 2013 | $5,797 | $305,100 | $121,100 | $184,000 |
Source: Public Records
Map
Nearby Homes
- 7 Oak Ridge Dr
- 20 Chandler Dr
- 27 Village Dr
- 7 Stevens Ct Unit 7
- 7 Stevens Ct
- 127 Cowbell Crossing
- Lot 3 Bels Way
- 21 Coles Way
- 3 Knightland Rd
- 40 Coles Way
- 18 Snug Harbor Ln
- 4 Huckleberry Ln
- 3 Providence Hill Rd
- 22 Knightland Rd
- 15 Cambridge Rd
- 9 Valcat Ln
- Lot 22-50 Valcat Ln
- 93 Stage Rd
- 27 Norwood Rd
- 10 Old Coach Rd
- 23 Brookside Terrace
- 25 Brookside Terrace
- 20 Brookside Terrace
- 18 Brookside Terrace
- 19 Brookside Terrace
- 17 Brookside Terrace
- 22 Stonewall Terrace
- 16 Brookside Terrace
- 8 Ashford Ln
- 13 Belknap Dr
- 11 Belknap Dr
- 11 Emery Dr
- 13 Emery Dr
- 14 Brookside Terrace
- 15 Brookside Terrace
- 9 Emery Dr
- 15 Emery Dr
- 9 Belknap Dr
- 17 Emery Dr
- 13 Brookside Terrace