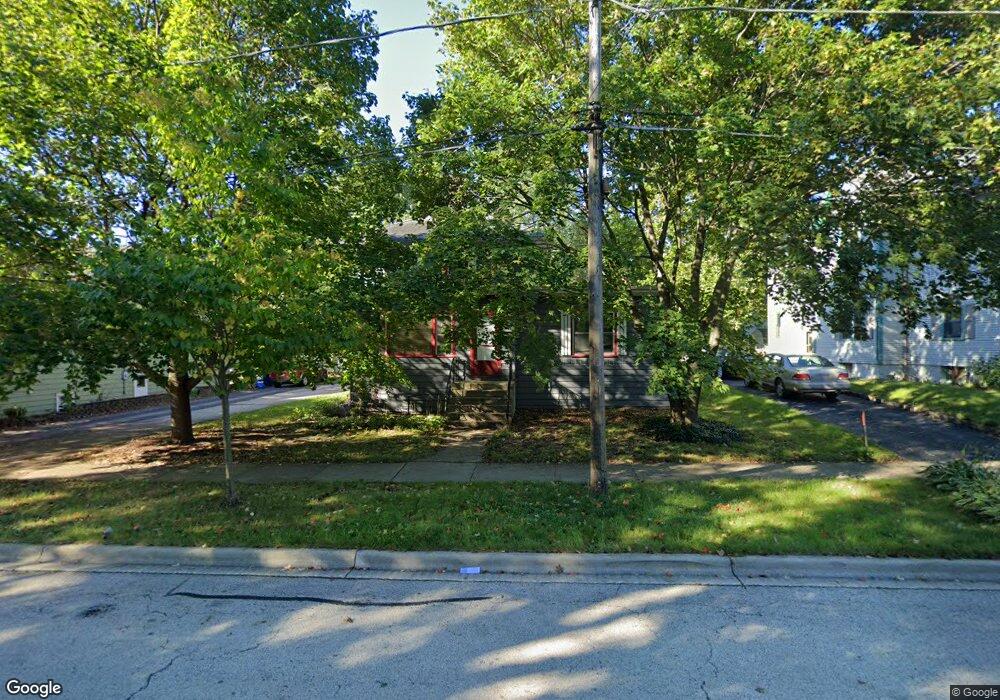
21 Center St Algonquin, IL 60102
Traube Fox River View NeighborhoodEstimated Value: $295,000 - $336,000
Studio
1
Bath
1,896
Sq Ft
$165/Sq Ft
Est. Value
About This Home
This home is located at 21 Center St, Algonquin, IL 60102 and is currently estimated at $312,187, approximately $164 per square foot. 21 Center St is a home located in McHenry County with nearby schools including Eastview Elementary School, Algonquin Middle School, and Dundee-Crown High School.
Ownership History
Date
Name
Owned For
Owner Type
Purchase Details
Closed on
Dec 21, 2011
Sold by
Larsen Erik
Bought by
Eppolito Gia and Larson Gia
Current Estimated Value
Purchase Details
Closed on
Dec 20, 2002
Sold by
Barker Captola B
Bought by
Larsen Erik and Eppolito Gia
Home Financials for this Owner
Home Financials are based on the most recent Mortgage that was taken out on this home.
Original Mortgage
$152,000
Interest Rate
6.3%
Purchase Details
Closed on
Nov 22, 1993
Sold by
Neely Judith L
Bought by
Barker Darla J and Barker Captola B
Create a Home Valuation Report for This Property
The Home Valuation Report is an in-depth analysis detailing your home's value as well as a comparison with similar homes in the area
Home Values in the Area
Average Home Value in this Area
Purchase History
| Date | Buyer | Sale Price | Title Company |
|---|---|---|---|
| Eppolito Gia | -- | Fidelity National Title | |
| Larsen Erik | $160,000 | Multiple | |
| Barker Darla J | $110,000 | Attorneys National Title |
Source: Public Records
Mortgage History
| Date | Status | Borrower | Loan Amount |
|---|---|---|---|
| Previous Owner | Larsen Erik | $152,000 |
Source: Public Records
Tax History
| Year | Tax Paid | Tax Assessment Tax Assessment Total Assessment is a certain percentage of the fair market value that is determined by local assessors to be the total taxable value of land and additions on the property. | Land | Improvement |
|---|---|---|---|---|
| 2024 | $6,724 | $93,954 | $20,534 | $73,420 |
| 2023 | $6,365 | $84,030 | $18,365 | $65,665 |
| 2022 | $5,077 | $65,205 | $11,523 | $53,682 |
| 2021 | $4,858 | $60,746 | $10,735 | $50,011 |
| 2020 | $4,723 | $58,596 | $10,355 | $48,241 |
| 2019 | $4,599 | $56,083 | $9,911 | $46,172 |
| 2018 | $4,366 | $51,809 | $9,156 | $42,653 |
| 2017 | $4,263 | $48,808 | $8,626 | $40,182 |
| 2016 | $4,183 | $45,777 | $8,090 | $37,687 |
| 2013 | -- | $47,853 | $7,548 | $40,305 |
Source: Public Records
Map
Nearby Homes
- 21 Division St
- 407 La Fox River Dr
- Lot #3-5 Hayes Rd
- 615 Harper Dr
- 0 River Dr N Unit MRD12473279
- 730 Chestnut Ct
- 0 Natoma Trail
- 600 E Algonquin Rd
- 719 Webster St
- 308 Rustic Ln
- lot 25 Wabican Trail
- 1 N Hubbard St
- SWC Talaga and Algonquin Rd
- 1188 E Algonquin Rd
- 953 Old Oak Cir
- 1105 Spring Hill Dr
- 720 Ash St
- 1420 Greenridge Ave
- 1031 Timberwood Ln
- 1033 Interloch Ct Unit 32
Your Personal Tour Guide
Ask me questions while you tour the home.