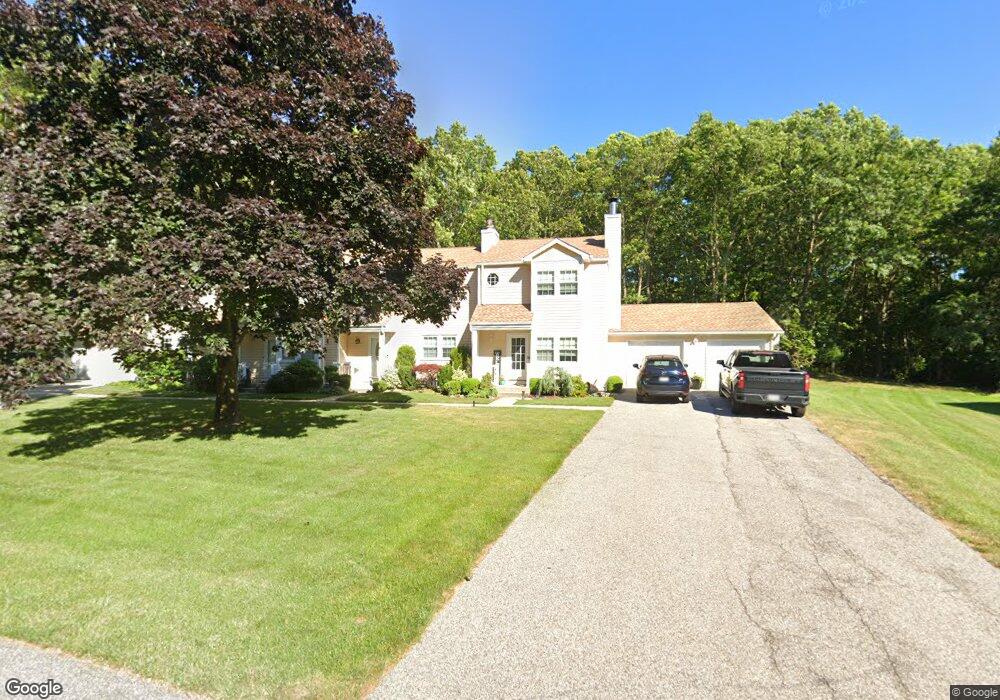
NOT LISTED FOR SALE

Estimated Value: $601,000

2 Beds
2 Baths
1,144 Sq Ft
$525/Sq Ft Est. Value

About This Home

This home is located at 21 Chase Commons, Yaphank, NY 11980 and is currently estimated at $601,000, approximately $525 per square foot. 21 Chase Commons is a home located in Suffolk County with nearby schools including Longwood Junior High School, Longwood Middle School, and Longwood Senior High School.

Ownership History

Date Name Owned For Owner Type

Purchase Details

Closed on
Oct 27, 2021
Sold by
Pizzinger Robert S
Bought by
Funfgeld Kathleen
Current Estimated Value
$601,000

Home Financials for this Owner

Home Financials are based on the most recent Mortgage that was taken out on this home.
Original Mortgage
$290,000
Outstanding Balance
$268,451
Interest Rate
3.14%
Mortgage Type
Stand Alone Refi Refinance Of Original Loan
Estimated Equity
$130,549

Purchase Details

Closed on
Jul 10, 2014
Sold by
Graf Barbara and Lakatos Daniel
Bought by
Pizzinger Robert S and Lakatos Luise

Home Financials for this Owner

Home Financials are based on the most recent Mortgage that was taken out on this home.
Original Mortgage
$204,250
Interest Rate
4.14%
Mortgage Type
New Conventional

Purchase Details

Closed on
Feb 7, 2008
Sold by
Lakatos Charles
Bought by
Trustees Graf, Barbara & Lakatos, Daniel and Trust Lakatos, Kardy A & K &

Range of Values:

Collateral Analytics

Collateral Analytics Collateral Analytics AVMs (Automated Valuation Model) employ a number of statistical approaches combined with neighborhood-specific comparable selection guarantees the most up-to-date and precise valuations.

Not Available

Collateral Analytics does not have data for the current month. Please view the chart for historical values.

ICE

ICE Mortgage Technology ICE Mortgage Technology’s AVM (Automated Valuation Model) is a state-of-the-art online residential property valuation tool that provides a quick and accurate estimate of the value of almost any home in the U.S.

Not Available

ICE Mortgage Technology does not have data for the current month. Please view the chart for historical values.

First American

First American First American Data & Analytics’ next-generation AVM combines unrivaled data assets with a blended ensemble of valuation models to produce highly accurate, reliable valuations you can trust.

Not Available

First American does not have data for the current month. Please view the chart for historical values.

Quantarium

Quantarium Quantarium’s valuation service, repeatedly proven the industry’s most accurate and comprehensive, is supercharged with a self-learning and auto-tuning AI engine that continually becomes smarter and more accurate as it processes daily inputs from the industry’s leading RE data lake.

Not Available

Quantarium does not have data for the current month. Please view the chart for historical values.

Average Value
Not Available
List Price
Sold Price
Create a Home Valuation Report for This Property
The Home Valuation Report is an in-depth analysis detailing your home's value as well as a comparison with similar homes in the area

Home Values in the Area

Source: Public Records

Average Home Value in this Area


Source: Public Records

Purchase History

Date Buyer Sale Price Title Company
Funfgeld Kathleen $350,000 None Available
Pizzinger Robert S $215,000 --
Trustees Graf, Barbara & Lakatos, Daniel -- Anne Marie Goodale
Source: Public Records

Mortgage History

Date Status Borrower Loan Amount
Open Funfgeld Kathleen $290,000
Closed Funfgeld Kathleen $290,000
Previous Owner Pizzinger Robert S $204,250
Source: Public Records

Tax History Compared to Growth

Source: Public Records

Tax History

Year Tax Paid Tax Assessment Tax Assessment Total Assessment is a certain percentage of the fair market value that is determined by local assessors to be the total taxable value of land and additions on the property. Land Improvement
2023 $4,837 $1,155 $115 $1,040
2022 $2,849 $1,155 $115 $1,040
2021 $2,849 $1,155 $115 $1,040
2020 $2,941 $1,155 $115 $1,040
2019 $2,941 $0 $0 $0
2018 $2,763 $1,155 $115 $1,040
2017 $2,763 $1,155 $115 $1,040
2016 $2,720 $1,155 $115 $1,040
2015 -- $1,415 $115 $1,300
2014 -- $1,415 $115 $1,300
Source: Public Records

Map