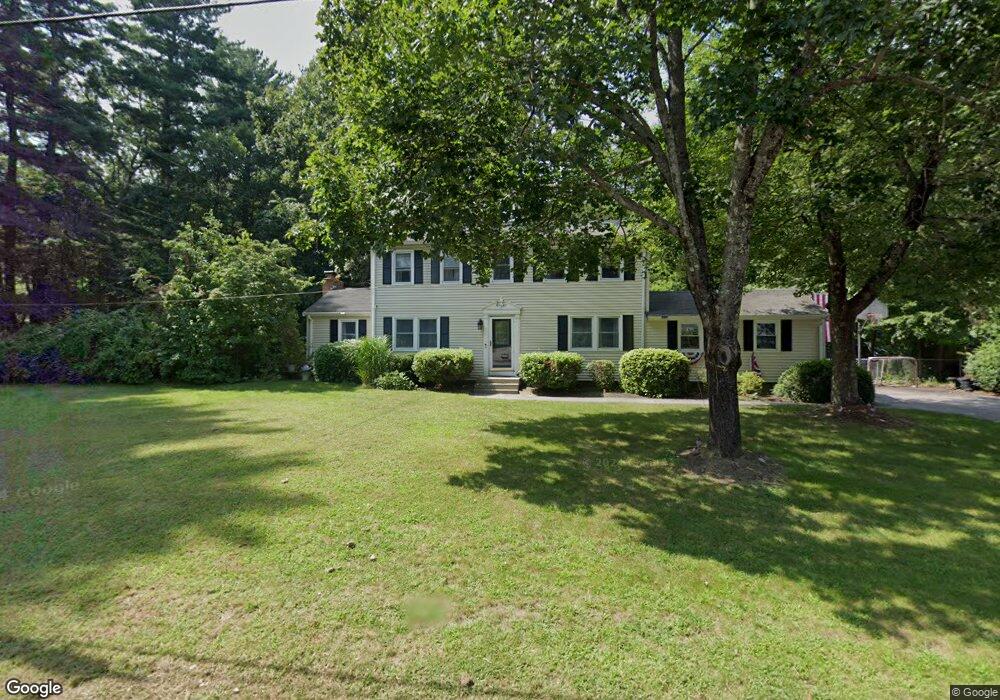
21 Colt Rd Franklin, MA 02038
Wadsworth NeighborhoodEstimated Value: $668,330 - $810,000
4
Beds
2
Baths
1,688
Sq Ft
$423/Sq Ft
Est. Value
About This Home
This home is located at 21 Colt Rd, Franklin, MA 02038 and is currently estimated at $714,083, approximately $423 per square foot. 21 Colt Rd is a home located in Norfolk County with nearby schools including Jefferson Elementary School, Remington Middle School, and Franklin High School.
Ownership History
Date
Name
Owned For
Owner Type
Purchase Details
Closed on
Sep 29, 2000
Sold by
Ryan William J and Ryan Ellen
Bought by
Joseph Jennifer
Current Estimated Value
Purchase Details
Closed on
Feb 17, 1988
Sold by
Walsh T Douglas
Bought by
Ryan William J
Create a Home Valuation Report for This Property
The Home Valuation Report is an in-depth analysis detailing your home's value as well as a comparison with similar homes in the area
Home Values in the Area
Average Home Value in this Area
Purchase History
| Date | Buyer | Sale Price | Title Company |
|---|---|---|---|
| Joseph Jennifer | $272,000 | -- | |
| Ryan William J | $199,900 | -- |
Source: Public Records
Mortgage History
| Date | Status | Borrower | Loan Amount |
|---|---|---|---|
| Open | Ryan William J | $319,800 | |
| Closed | Ryan William J | $7,500 |
Source: Public Records
Tax History Compared to Growth
Tax History
| Year | Tax Paid | Tax Assessment Tax Assessment Total Assessment is a certain percentage of the fair market value that is determined by local assessors to be the total taxable value of land and additions on the property. | Land | Improvement |
|---|---|---|---|---|
| 2025 | $6,672 | $574,200 | $242,800 | $331,400 |
| 2024 | $6,377 | $540,900 | $242,800 | $298,100 |
| 2023 | $6,188 | $491,900 | $253,300 | $238,600 |
| 2022 | $5,895 | $419,600 | $209,300 | $210,300 |
| 2021 | $5,473 | $373,600 | $205,300 | $168,300 |
| 2020 | $5,523 | $380,600 | $220,600 | $160,000 |
| 2019 | $5,272 | $359,600 | $199,500 | $160,100 |
| 2018 | $5,166 | $352,600 | $209,100 | $143,500 |
| 2017 | $4,890 | $335,400 | $191,900 | $143,500 |
| 2016 | $4,795 | $330,700 | $204,800 | $125,900 |
| 2015 | $4,553 | $306,800 | $180,900 | $125,900 |
| 2014 | $4,284 | $296,500 | $170,600 | $125,900 |
Source: Public Records
Map
Nearby Homes
- 17 Stanford Rd
- 10 Stanford Rd
- 1 Spring St
- 851 Washington St
- 584 Washington St
- 8 Bubbling Brook Rd
- 732 King St
- 0 Prospect St
- 236 Williams St
- 50 Wamsutta Way
- 246 Washington St
- 2095 West St
- 352 Lake St
- 2 Duhamel Way
- 89 Lakeview Ave
- 16 Danforth Way
- 151 Stone Ridge Rd
- 417 Union St
- 1 Joy St
- 109 Stone Ridge Rd Unit 109