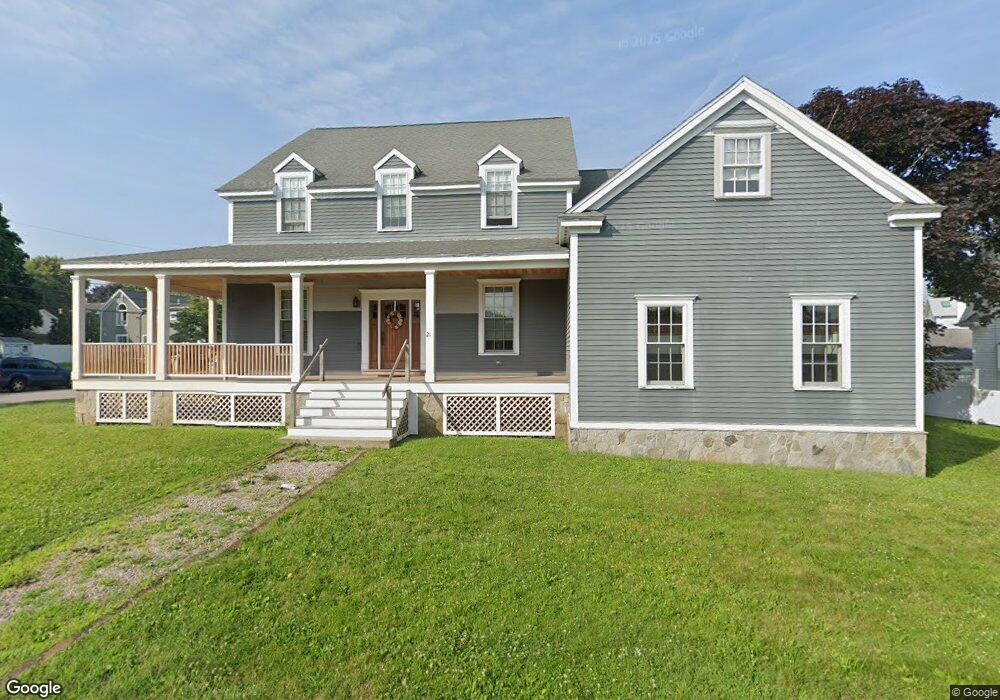
21 Fullers Ln Milton, MA 02186
Estimated Value: $1,919,177 - $2,074,000
4
Beds
4
Baths
3,745
Sq Ft
$540/Sq Ft
Est. Value
About This Home
This home is located at 21 Fullers Ln, Milton, MA 02186 and is currently estimated at $2,021,544, approximately $539 per square foot. 21 Fullers Ln is a home located in Norfolk County with nearby schools including Milton High School, St. Agatha School, and Milton Academy.
Ownership History
Date
Name
Owned For
Owner Type
Purchase Details
Closed on
May 24, 2024
Sold by
Earner Martin J and Earner Noreen M
Bought by
Fullers Lane T and Fullers Hayes
Current Estimated Value
Purchase Details
Closed on
Jun 19, 1991
Sold by
Fhlmc
Bought by
Earner Martin J
Home Financials for this Owner
Home Financials are based on the most recent Mortgage that was taken out on this home.
Original Mortgage
$128,000
Interest Rate
9.37%
Mortgage Type
Purchase Money Mortgage
Purchase Details
Closed on
Jun 12, 1991
Sold by
Holmes Joy E Est
Bought by
Fhlmc
Home Financials for this Owner
Home Financials are based on the most recent Mortgage that was taken out on this home.
Original Mortgage
$128,000
Interest Rate
9.37%
Mortgage Type
Purchase Money Mortgage
Create a Home Valuation Report for This Property
The Home Valuation Report is an in-depth analysis detailing your home's value as well as a comparison with similar homes in the area
Home Values in the Area
Average Home Value in this Area
Purchase History
| Date | Buyer | Sale Price | Title Company |
|---|---|---|---|
| Fullers Lane T | -- | None Available | |
| Fullers Lane T | -- | None Available | |
| Earner Martin J | $160,000 | -- | |
| Fhlmc | $179,600 | -- |
Source: Public Records
Mortgage History
| Date | Status | Borrower | Loan Amount |
|---|---|---|---|
| Previous Owner | Fhlmc | $157,500 | |
| Previous Owner | Fhlmc | $126,000 | |
| Previous Owner | Fhlmc | $128,000 | |
| Previous Owner | Fhlmc | $26,950 |
Source: Public Records
Tax History Compared to Growth
Tax History
| Year | Tax Paid | Tax Assessment Tax Assessment Total Assessment is a certain percentage of the fair market value that is determined by local assessors to be the total taxable value of land and additions on the property. | Land | Improvement |
|---|---|---|---|---|
| 2025 | $18,198 | $1,640,900 | $518,800 | $1,122,100 |
| 2024 | $17,704 | $1,621,200 | $494,000 | $1,127,200 |
| 2023 | $16,804 | $1,474,000 | $470,600 | $1,003,400 |
| 2022 | $15,654 | $1,255,300 | $470,600 | $784,700 |
| 2021 | $14,897 | $1,134,600 | $380,900 | $753,700 |
| 2020 | $14,534 | $1,107,800 | $365,000 | $742,800 |
| 2019 | $14,176 | $1,075,600 | $354,400 | $721,200 |
| 2018 | $14,491 | $1,049,300 | $334,200 | $715,100 |
| 2017 | $13,583 | $1,001,700 | $318,300 | $683,400 |
| 2016 | $13,181 | $976,400 | $303,800 | $672,600 |
| 2015 | $13,281 | $952,700 | $282,100 | $670,600 |
Source: Public Records
Map
Nearby Homes
- 418 Pleasant St
- 46 Century Ln
- 461 Centre St
- 639 Pleasant St Unit 639
- 639 Pleasant St
- 64 Shawmut St
- 40 Lyman Rd
- 397 Adams St
- 111 Shawmut St
- 400 Adams St Unit A
- 400 Adams St Unit B
- 111-113 Pleasant St
- 29 Maitland St
- 66 Unity St
- 29 Oconnell Ave
- 403405 Reedsdale Rd
- 71 Cabot St
- 795 Brook Rd
- 55 Christopher Dr
- 60 Pond St