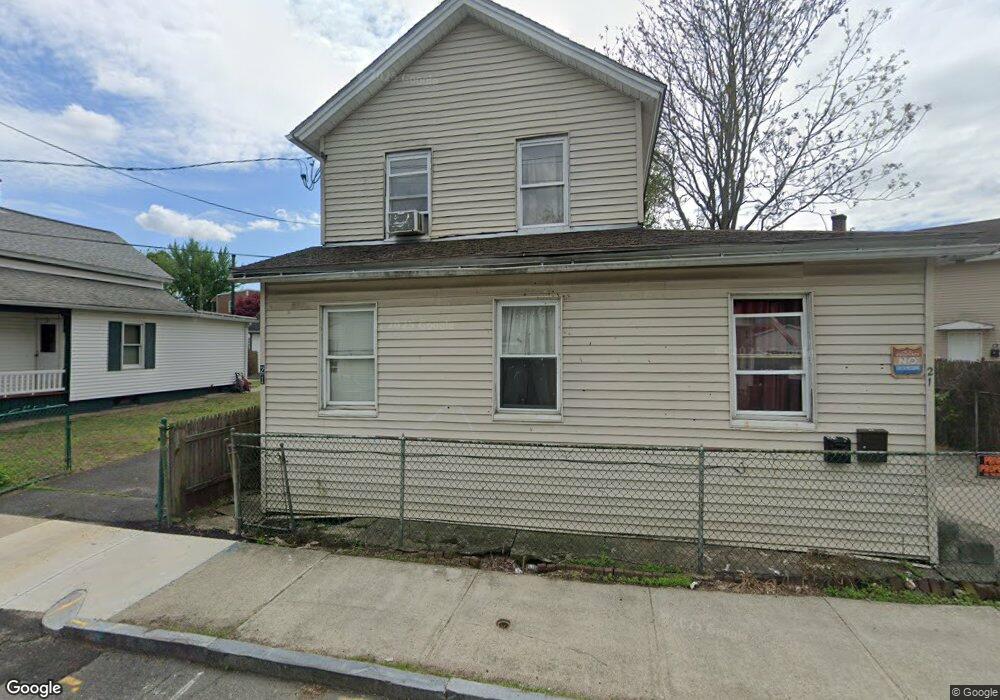
21 Globe St West Springfield, MA 01089
Estimated Value: $261,729 - $386,000
3
Beds
3
Baths
1,382
Sq Ft
$242/Sq Ft
Est. Value
About This Home
This home is located at 21 Globe St, West Springfield, MA 01089 and is currently estimated at $334,932, approximately $242 per square foot. 21 Globe St is a home located in Hampden County with nearby schools including Hampden Charter School of Science West, Libertas Academy Charter School, and Springfield Commonwealth Academy.
Ownership History
Date
Name
Owned For
Owner Type
Purchase Details
Closed on
Jul 13, 1998
Sold by
Caputo Lewis G
Bought by
Bechard Theresa
Current Estimated Value
Purchase Details
Closed on
Oct 6, 1995
Sold by
Ludlow Sb
Bought by
Caputo Lewis G
Purchase Details
Closed on
Nov 4, 1992
Sold by
Castle Hills Invest
Bought by
Ludlow Sb
Purchase Details
Closed on
Jun 25, 1987
Sold by
Luce Kenneth R
Bought by
Castle Hills Invest Co
Home Financials for this Owner
Home Financials are based on the most recent Mortgage that was taken out on this home.
Original Mortgage
$72,000
Interest Rate
10.5%
Mortgage Type
Purchase Money Mortgage
Purchase Details
Closed on
Mar 31, 1987
Sold by
Gomes Edward A
Bought by
Luce Kenneth R
Create a Home Valuation Report for This Property
The Home Valuation Report is an in-depth analysis detailing your home's value as well as a comparison with similar homes in the area
Home Values in the Area
Average Home Value in this Area
Purchase History
| Date | Buyer | Sale Price | Title Company |
|---|---|---|---|
| Bechard Theresa | $10,000 | -- | |
| Bechard Theresa | $10,000 | -- | |
| Caputo Lewis G | $7,000 | -- | |
| Caputo Lewis G | $7,000 | -- | |
| Ludlow Sb | $48,500 | -- | |
| Ludlow Sb | $48,500 | -- | |
| Castle Hills Invest Co | $54,000 | -- | |
| Luce Kenneth R | $53,000 | -- |
Source: Public Records
Mortgage History
| Date | Status | Borrower | Loan Amount |
|---|---|---|---|
| Previous Owner | Luce Kenneth R | $72,000 | |
| Closed | Luce Kenneth R | $0 |
Source: Public Records
Tax History Compared to Growth
Tax History
| Year | Tax Paid | Tax Assessment Tax Assessment Total Assessment is a certain percentage of the fair market value that is determined by local assessors to be the total taxable value of land and additions on the property. | Land | Improvement |
|---|---|---|---|---|
| 2025 | $2,715 | $182,600 | $63,000 | $119,600 |
| 2024 | $2,704 | $182,600 | $63,000 | $119,600 |
| 2023 | $2,434 | $156,600 | $63,000 | $93,600 |
| 2022 | $2,377 | $150,800 | $57,200 | $93,600 |
| 2021 | $1,861 | $110,100 | $45,100 | $65,000 |
| 2020 | $1,871 | $110,100 | $45,100 | $65,000 |
| 2019 | $1,867 | $110,100 | $45,100 | $65,000 |
| 2018 | $1,877 | $110,100 | $45,100 | $65,000 |
| 2017 | $1,877 | $110,100 | $45,100 | $65,000 |
| 2016 | $1,842 | $108,400 | $43,400 | $65,000 |
| 2015 | $1,748 | $102,900 | $42,500 | $60,400 |
| 2014 | $1,689 | $102,900 | $42,500 | $60,400 |
Source: Public Records
Map
Nearby Homes
- 31 Russell St
- 37 Day St
- 44 Spring St
- 140 Chestnut St Unit 706
- 140 Chestnut St Unit 204
- 140 Chestnut St Unit 819
- 140 Chestnut St Unit 607
- 140 Chestnut St Unit 210
- 140 Chestnut St Unit 202
- 140 Chestnut St Unit 604
- 140 Chestnut St Unit 709
- 385 Worthington St Unit 3D
- 61-63 Wilcox St
- 69 Winter St
- 53 Fremont St
- 13 Ringgold St
- 235 State St Unit 105
- 235 State St Unit 409
- 235 State St Unit 220
- 62 Central St Unit 402