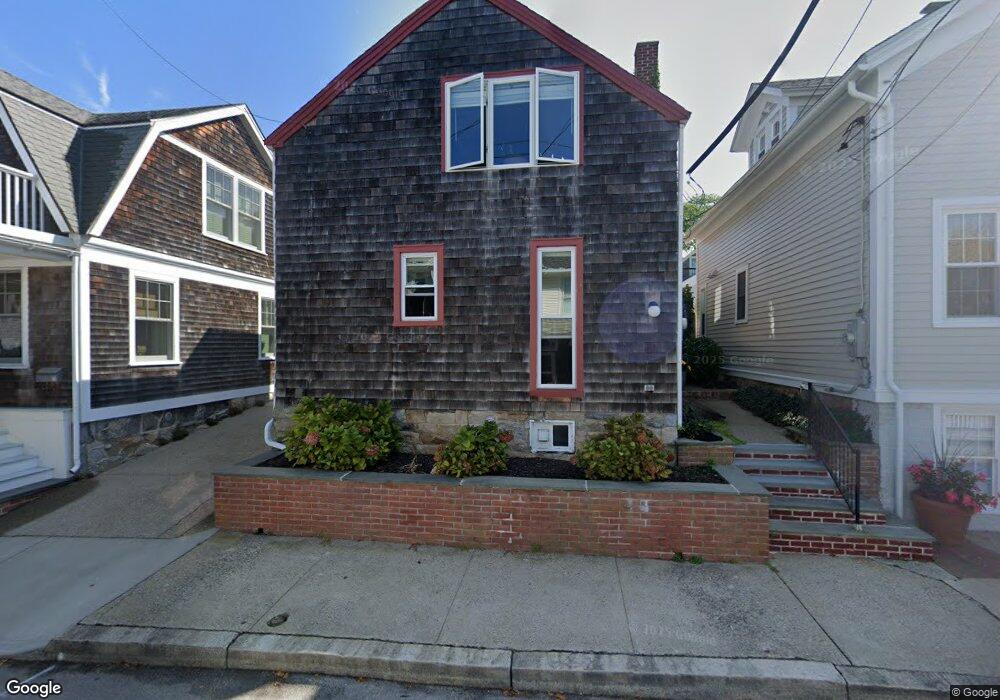
21 Water St Stonington, CT 06378
Estimated Value: $503,000 - $1,071,000
2
Beds
2
Baths
1,556
Sq Ft
$593/Sq Ft
Est. Value
About This Home
This home is located at 21 Water St, Stonington, CT 06378 and is currently estimated at $922,004, approximately $592 per square foot. 21 Water St is a home located in New London County with nearby schools including Stonington Middle School, Stonington High School, and Pine Point School.
Ownership History
Date
Name
Owned For
Owner Type
Purchase Details
Closed on
Jun 6, 2023
Sold by
Conrad Suzanne
Bought by
Suzanne Conrad Lt and Conrad
Current Estimated Value
Purchase Details
Closed on
Feb 12, 2019
Sold by
Cole Sara M
Bought by
Conrad Suzanne
Purchase Details
Closed on
Mar 26, 2015
Sold by
Winifred G Lagrua Ret and Papp
Bought by
Winifred G Lagrua Ret and Papp
Create a Home Valuation Report for This Property
The Home Valuation Report is an in-depth analysis detailing your home's value as well as a comparison with similar homes in the area
Home Values in the Area
Average Home Value in this Area
Purchase History
| Date | Buyer | Sale Price | Title Company |
|---|---|---|---|
| Suzanne Conrad Lt | -- | None Available | |
| Suzanne Conrad Lt | -- | None Available | |
| Conrad Suzanne | -- | -- | |
| Conrad Suzanne | -- | -- | |
| Conrad Suzanne | -- | -- | |
| Winifred G Lagrua Ret | -- | -- | |
| Winifred G Lagrua Ret | -- | -- | |
| Winifred G Lagrua Ret | -- | -- |
Source: Public Records
Mortgage History
| Date | Status | Borrower | Loan Amount |
|---|---|---|---|
| Previous Owner | Winifred G Lagrua Ret | $125,000 |
Source: Public Records
Tax History Compared to Growth
Tax History
| Year | Tax Paid | Tax Assessment Tax Assessment Total Assessment is a certain percentage of the fair market value that is determined by local assessors to be the total taxable value of land and additions on the property. | Land | Improvement |
|---|---|---|---|---|
| 2025 | $12,477 | $613,300 | $412,800 | $200,500 |
| 2024 | $11,959 | $613,300 | $412,800 | $200,500 |
| 2023 | $8,112 | $412,800 | $412,800 | $0 |
| 2022 | $8,854 | $332,100 | $238,100 | $94,000 |
| 2021 | $8,917 | $332,100 | $238,100 | $94,000 |
| 2020 | $8,754 | $332,100 | $238,100 | $94,000 |
| 2019 | $8,754 | $332,100 | $238,100 | $94,000 |
| 2018 | $8,495 | $332,100 | $238,100 | $94,000 |
| 2017 | $7,932 | $307,100 | $206,400 | $100,700 |
| 2016 | $7,711 | $307,100 | $206,400 | $100,700 |
| 2015 | $7,377 | $307,100 | $206,400 | $100,700 |
| 2014 | $7,042 | $307,100 | $206,400 | $100,700 |
Source: Public Records
Map
Nearby Homes