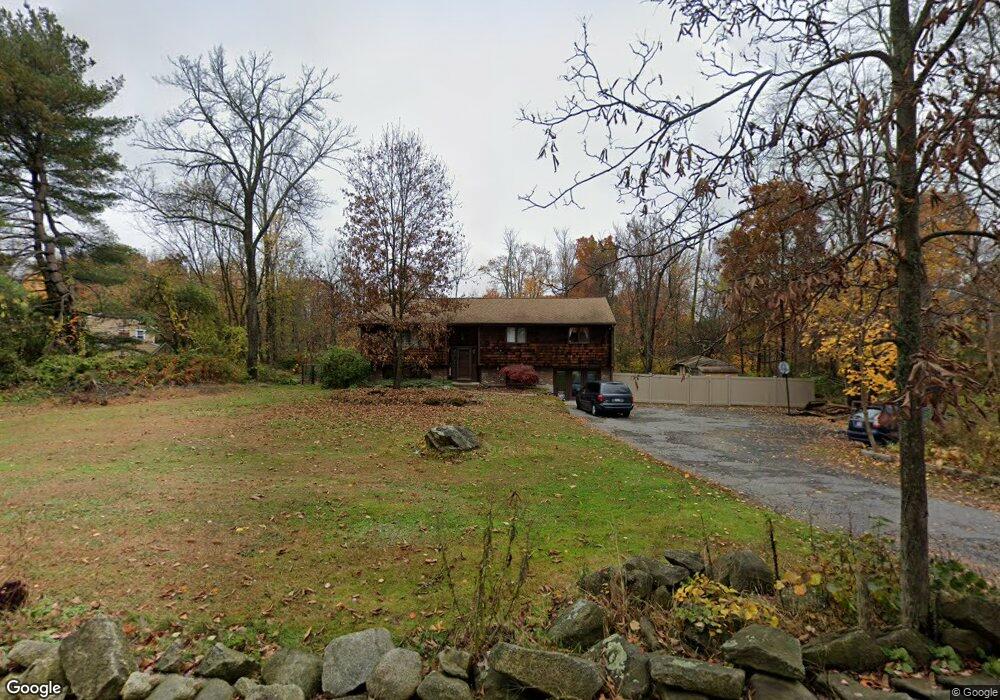
21 Whitewood Rd Milford, MA 01757
Estimated Value: $735,000 - $804,000
3
Beds
4
Baths
3,668
Sq Ft
$211/Sq Ft
Est. Value
About This Home
This home is located at 21 Whitewood Rd, Milford, MA 01757 and is currently estimated at $772,217, approximately $210 per square foot. 21 Whitewood Rd is a home located in Worcester County with nearby schools including Milford High School.
Ownership History
Date
Name
Owned For
Owner Type
Purchase Details
Closed on
Jul 16, 2020
Sold by
Charles D Hince D 4A T
Bought by
Donovan Christine M and Donovan John E
Current Estimated Value
Home Financials for this Owner
Home Financials are based on the most recent Mortgage that was taken out on this home.
Original Mortgage
$317,600
Outstanding Balance
$281,627
Interest Rate
3.1%
Mortgage Type
New Conventional
Estimated Equity
$490,590
Purchase Details
Closed on
Dec 19, 2018
Sold by
Hince Susan M
Bought by
Charles D Hince D4a T
Purchase Details
Closed on
Jun 19, 1992
Sold by
Hince Denis R
Bought by
Hince Susan M
Home Financials for this Owner
Home Financials are based on the most recent Mortgage that was taken out on this home.
Original Mortgage
$85,000
Interest Rate
8.67%
Mortgage Type
Purchase Money Mortgage
Create a Home Valuation Report for This Property
The Home Valuation Report is an in-depth analysis detailing your home's value as well as a comparison with similar homes in the area
Home Values in the Area
Average Home Value in this Area
Purchase History
| Date | Buyer | Sale Price | Title Company |
|---|---|---|---|
| Donovan Christine M | -- | None Available | |
| Charles D Hince D4a T | -- | -- | |
| Hince Susan M | $68,985 | -- |
Source: Public Records
Mortgage History
| Date | Status | Borrower | Loan Amount |
|---|---|---|---|
| Open | Donovan Christine M | $317,600 | |
| Previous Owner | Hince Susan M | $127,000 | |
| Previous Owner | Hince Susan M | $55,000 | |
| Previous Owner | Hince Susan M | $85,000 |
Source: Public Records
Tax History Compared to Growth
Tax History
| Year | Tax Paid | Tax Assessment Tax Assessment Total Assessment is a certain percentage of the fair market value that is determined by local assessors to be the total taxable value of land and additions on the property. | Land | Improvement |
|---|---|---|---|---|
| 2025 | $8,429 | $658,500 | $211,000 | $447,500 |
| 2024 | $8,224 | $618,800 | $202,900 | $415,900 |
| 2023 | $7,634 | $528,300 | $168,400 | $359,900 |
| 2022 | $7,324 | $475,900 | $154,200 | $321,700 |
| 2021 | $6,961 | $435,600 | $154,200 | $281,400 |
| 2020 | $6,818 | $427,200 | $154,200 | $273,000 |
| 2019 | $6,310 | $381,500 | $154,200 | $227,300 |
| 2018 | $6,164 | $372,200 | $156,200 | $216,000 |
| 2017 | $6,009 | $357,900 | $156,200 | $201,700 |
| 2016 | $5,681 | $330,700 | $156,200 | $174,500 |
| 2015 | $5,656 | $322,300 | $156,200 | $166,100 |
Source: Public Records
Map
Nearby Homes