Estimated Value: $184,000 - $221,000
2
Beds
2
Baths
1,082
Sq Ft
$184/Sq Ft
Est. Value
About This Home
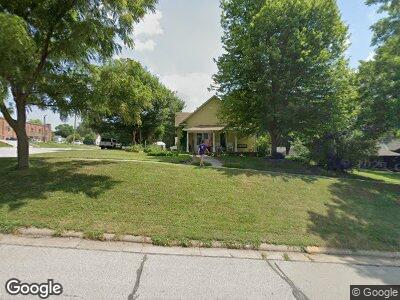
This home is located at 210 4th St, Neola, IA 51559 and is currently estimated at $198,993, approximately $183 per square foot. 210 4th St is a home located in Pottawattamie County with nearby schools including Tri-Center Elementary School, Tri-Center Middle School, and Tri-Center High School.
Ownership History
Date
Name
Owned For
Owner Type
Purchase Details
Closed on
Jul 19, 2017
Sold by
Alstrom Steve
Bought by
Robinson Paul G
Current Estimated Value
Home Financials for this Owner
Home Financials are based on the most recent Mortgage that was taken out on this home.
Original Mortgage
$117,826
Outstanding Balance
$100,711
Interest Rate
3.9%
Mortgage Type
FHA
Purchase Details
Closed on
Oct 23, 2013
Sold by
Christensen Geralyn Marie and Bjorling Geralyn M
Bought by
Bjorling Mark W and Bjorling Geralyn M
Purchase Details
Closed on
Oct 1, 2013
Sold by
Christensen Geralyn Marie and Bjorling Geralyn M
Bought by
Bjorling Mark W and Bjorling Geralyn M
Create a Home Valuation Report for This Property
The Home Valuation Report is an in-depth analysis detailing your home's value as well as a comparison with similar homes in the area
Home Values in the Area
Average Home Value in this Area
Purchase History
| Date | Buyer | Sale Price | Title Company |
|---|---|---|---|
| Robinson Paul G | $120,000 | None Available | |
| Bjorling Mark W | -- | None Available | |
| Bjorling Mark W | -- | None Available |
Source: Public Records
Mortgage History
| Date | Status | Borrower | Loan Amount |
|---|---|---|---|
| Open | Robinson Paul G | $117,826 | |
| Previous Owner | Bjorling Geralyn | $25,000 | |
| Previous Owner | Bjorling Geralyn M | $13,000 |
Source: Public Records
Tax History Compared to Growth
Tax History
| Year | Tax Paid | Tax Assessment Tax Assessment Total Assessment is a certain percentage of the fair market value that is determined by local assessors to be the total taxable value of land and additions on the property. | Land | Improvement |
|---|---|---|---|---|
| 2024 | $2,254 | $147,400 | $24,100 | $123,300 |
| 2023 | $2,254 | $147,400 | $24,100 | $123,300 |
| 2022 | $2,148 | $119,400 | $24,100 | $95,300 |
| 2021 | $3,275 | $119,400 | $24,100 | $95,300 |
| 2020 | $1,718 | $119,400 | $24,100 | $95,300 |
| 2019 | $1,732 | $95,000 | $16,760 | $78,240 |
| 2018 | $1,690 | $95,000 | $16,760 | $78,240 |
| 2017 | $1,708 | $95,000 | $16,760 | $78,240 |
| 2015 | $1,712 | $95,000 | $16,760 | $78,240 |
| 2014 | $1,742 | $95,000 | $16,760 | $78,240 |
Source: Public Records
Map
Nearby Homes