Estimated Value: $542,424 - $612,000
3
Beds
3
Baths
1,757
Sq Ft
$330/Sq Ft
Est. Value
About This Home
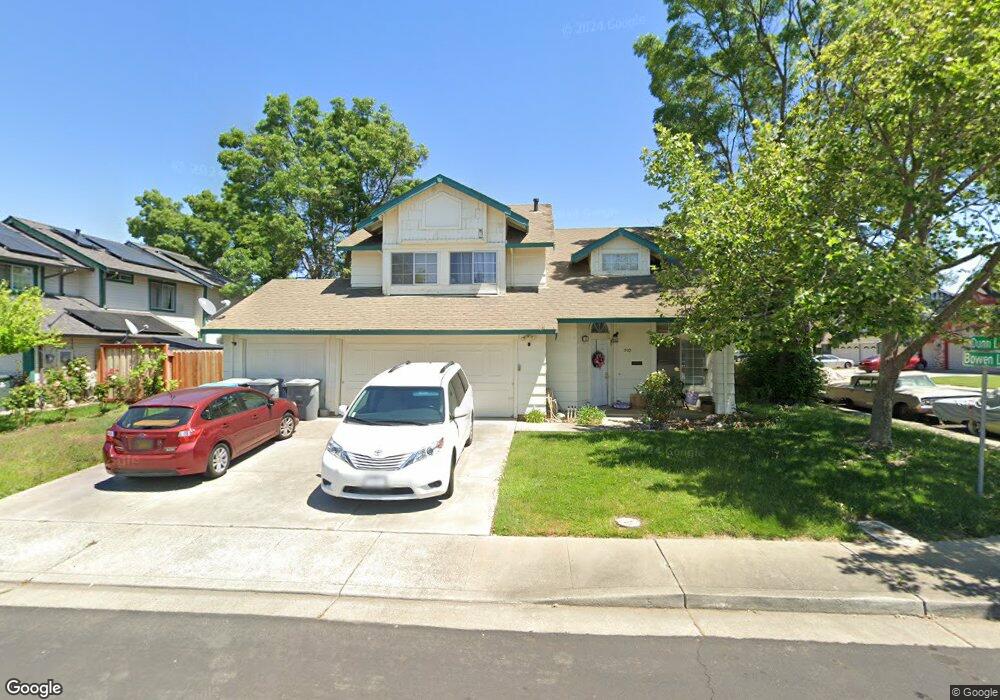
This home is located at 210 Bowen Ln, Dixon, CA 95620 and is currently estimated at $579,606, approximately $329 per square foot. 210 Bowen Ln is a home located in Solano County with nearby schools including Tremont Elementary School, Dixon High School, and Dixon Montessori Charter.
Ownership History
Date
Name
Owned For
Owner Type
Purchase Details
Closed on
Sep 28, 2004
Sold by
Cardenas Juan
Bought by
Cardenas Tomas
Current Estimated Value
Home Financials for this Owner
Home Financials are based on the most recent Mortgage that was taken out on this home.
Original Mortgage
$160,000
Interest Rate
5.16%
Mortgage Type
New Conventional
Purchase Details
Closed on
Sep 5, 2001
Sold by
Cardenas Juan
Bought by
Cardenas Tomas
Purchase Details
Closed on
Jan 15, 1998
Sold by
The United States Of America
Bought by
Cardenas Tomas and Cardenas Juan
Home Financials for this Owner
Home Financials are based on the most recent Mortgage that was taken out on this home.
Original Mortgage
$137,066
Interest Rate
7.13%
Mortgage Type
FHA
Purchase Details
Closed on
Oct 9, 1997
Sold by
Faaborg Timothy P
Bought by
The United States Of America
Create a Home Valuation Report for This Property
The Home Valuation Report is an in-depth analysis detailing your home's value as well as a comparison with similar homes in the area
Home Values in the Area
Average Home Value in this Area
Purchase History
| Date | Buyer | Sale Price | Title Company |
|---|---|---|---|
| Cardenas Tomas | -- | North American Title Co | |
| Cardenas Tomas | -- | -- | |
| Cardenas Tomas | -- | Sacramento Title Company | |
| The United States Of America | -- | Sacramento Title Company |
Source: Public Records
Mortgage History
| Date | Status | Borrower | Loan Amount |
|---|---|---|---|
| Closed | Cardenas Tomas | $160,000 | |
| Closed | Cardenas Tomas | $137,066 |
Source: Public Records
Tax History Compared to Growth
Tax History
| Year | Tax Paid | Tax Assessment Tax Assessment Total Assessment is a certain percentage of the fair market value that is determined by local assessors to be the total taxable value of land and additions on the property. | Land | Improvement |
|---|---|---|---|---|
| 2025 | $2,745 | $233,918 | $79,834 | $154,084 |
| 2024 | $2,745 | $229,332 | $78,269 | $151,063 |
| 2023 | $2,666 | $224,836 | $76,735 | $148,101 |
| 2022 | $2,627 | $220,429 | $75,231 | $145,198 |
| 2021 | $2,594 | $216,107 | $73,756 | $142,351 |
| 2020 | $2,553 | $213,892 | $73,000 | $140,892 |
| 2019 | $2,506 | $209,699 | $71,569 | $138,130 |
| 2018 | $2,495 | $205,588 | $70,166 | $135,422 |
| 2017 | $2,434 | $201,558 | $68,791 | $132,767 |
| 2016 | $2,327 | $197,607 | $67,443 | $130,164 |
| 2015 | $2,275 | $194,639 | $66,430 | $128,209 |
| 2014 | $2,251 | $190,827 | $65,129 | $125,698 |
Source: Public Records
Map
Nearby Homes
- 1805 Derby Dr
- 545 Pheasant Run Dr
- 1340 Snowberry Ct
- 1349 Snowberry Ct
- 1250 Redwood Ct
- 1251 Redwood Ct
- 1150 Mulberry Ln
- 1615 Sequoia Way
- 1310 Hawthorne Ct
- 255 Alderglen Dr
- 2040 Mariposa Dr
- 1765 Butterfly Ln
- 550 N Lincoln St
- 1535 Eisenhower Ct
- 2195 Prairie Way
- 635 Songbird Way
- 730 Daybreak Dr
- 970 Camelia Dr
- 540 Glenside Dr
- 920 N Lincoln St