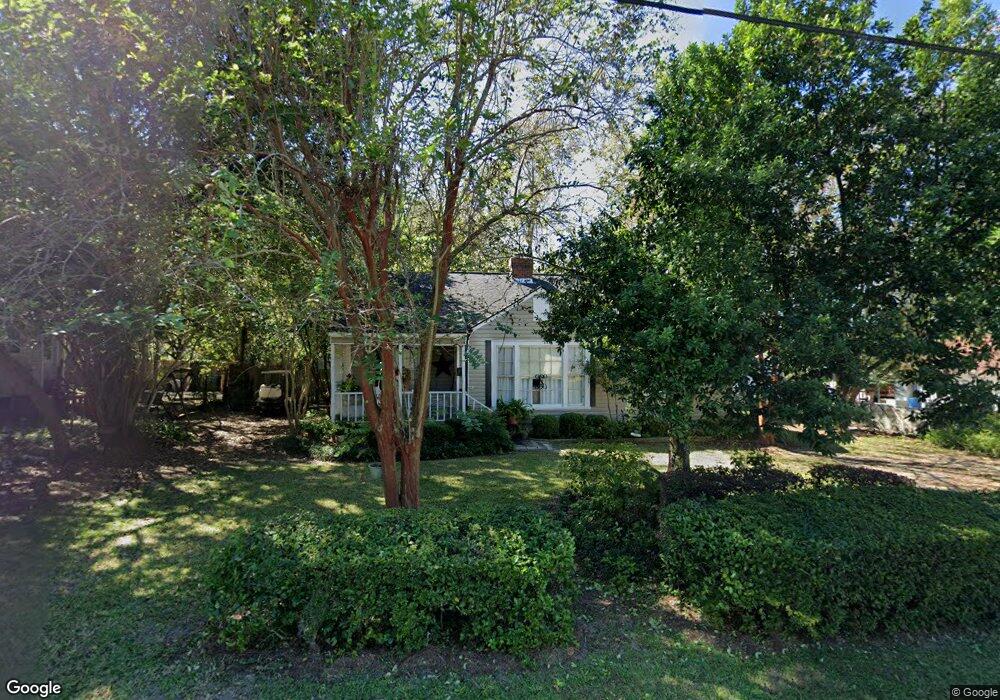
210 Darling St Blackshear, GA 31516
Estimated Value: $141,838 - $164,000
2
Beds
1
Bath
1,448
Sq Ft
$106/Sq Ft
Est. Value
About This Home
This home is located at 210 Darling St, Blackshear, GA 31516 and is currently estimated at $153,210, approximately $105 per square foot. 210 Darling St is a home located in Pierce County with nearby schools including Pierce County High School, Southeast Christian Academy, and Truth Christian Academy.
Ownership History
Date
Name
Owned For
Owner Type
Purchase Details
Closed on
Aug 10, 2020
Sold by
Smith Rita
Bought by
Smith Shawn C and Smith Connie R
Current Estimated Value
Purchase Details
Closed on
Feb 1, 2013
Sold by
Smith Rita
Bought by
Smith Shawn C
Purchase Details
Closed on
Mar 3, 2008
Sold by
Sawyer Nellie M
Bought by
Smith Rita
Purchase Details
Closed on
Jul 25, 1980
Sold by
Jones Eldon G
Bought by
Sawyer William L and Sawyer Nellie M
Purchase Details
Closed on
Mar 12, 1979
Sold by
Jones Eldon G and Jones Inez
Bought by
Lary Edward B and Lary Hudson J
Purchase Details
Closed on
May 4, 1978
Sold by
Robson Bruce Etal
Bought by
Jones Eldon G and J R
Purchase Details
Closed on
Nov 2, 1976
Sold by
Dixon M L
Bought by
Jones Eldon G and Inez Jones
Purchase Details
Closed on
Jan 3, 1952
Sold by
Barton C F
Bought by
Herrin Walker B
Purchase Details
Closed on
Aug 16, 1947
Sold by
Barton C F
Bought by
Herrin Walker B
Create a Home Valuation Report for This Property
The Home Valuation Report is an in-depth analysis detailing your home's value as well as a comparison with similar homes in the area
Home Values in the Area
Average Home Value in this Area
Purchase History
| Date | Buyer | Sale Price | Title Company |
|---|---|---|---|
| Smith Shawn C | -- | -- | |
| Smith Shawn C | -- | -- | |
| Smith Rita | -- | -- | |
| Sawyer William L | -- | -- | |
| Lary Edward B | -- | -- | |
| Jones Eldon G | -- | -- | |
| Jones Eldon G | -- | -- | |
| Herrin Walker B | -- | -- | |
| Herrin Walker B | -- | -- |
Source: Public Records
Tax History Compared to Growth
Tax History
| Year | Tax Paid | Tax Assessment Tax Assessment Total Assessment is a certain percentage of the fair market value that is determined by local assessors to be the total taxable value of land and additions on the property. | Land | Improvement |
|---|---|---|---|---|
| 2025 | $1,213 | $39,645 | $3,060 | $36,585 |
| 2024 | $1,213 | $37,816 | $3,060 | $34,756 |
| 2023 | $1,171 | $36,507 | $3,060 | $33,447 |
| 2022 | $828 | $21,788 | $3,766 | $18,022 |
| 2021 | $862 | $21,068 | $3,766 | $17,302 |
| 2020 | $843 | $20,346 | $3,766 | $16,580 |
| 2019 | $843 | $20,346 | $3,766 | $16,580 |
| 2018 | $772 | $18,602 | $3,766 | $14,836 |
| 2017 | $757 | $18,181 | $3,766 | $14,415 |
| 2016 | $755 | $18,181 | $3,766 | $14,415 |
| 2015 | $572 | $18,180 | $3,766 | $14,415 |
| 2014 | $572 | $18,181 | $3,766 | $14,415 |
| 2013 | $572 | $18,180 | $3,766 | $14,414 |
Source: Public Records
Map
Nearby Homes
- 331 Central Ave W
- 420 Jackson St
- 810 Jackson St
- 0001 Georgia 121
- ST. ROUTE 121 Georgia 121
- 515 Grady St
- 322 Mcgregor St
- 1157 Tanner Cir
- 622 E Main St
- 706 Jenkins St
- 830 Jane St
- 121 Beaver Dr
- TRACT 1 Trudie Rd
- 936 Azalea St
- 933 Azalea St
- 915 Jane St
- 113 Tatum Ln
- 118 Pinehurst Dr
- 3551 Cason Rd
- 131 Fawn Ln
- 214 Darling St
- 3667 U S 84
- 211 Darling Ave
- 211 Darling St
- 341 NE Central Ave
- 331 NE Central Ave
- 3687 Us Highway 84
- 219 Darling St
- 3661 Us Highway 84
- 405 NE Central Ave
- 405 NE Central Ave
- 3648 Us Highway 84
- 3689 Us Highway 84
- 3693 Us Highway 84
- 323 NE Central Ave
- 3653 Us Highway 84
- 3682 U S 84
- 3682 Us Highway 84
- 413 NE Central Ave
- 3684 Us Highway 84