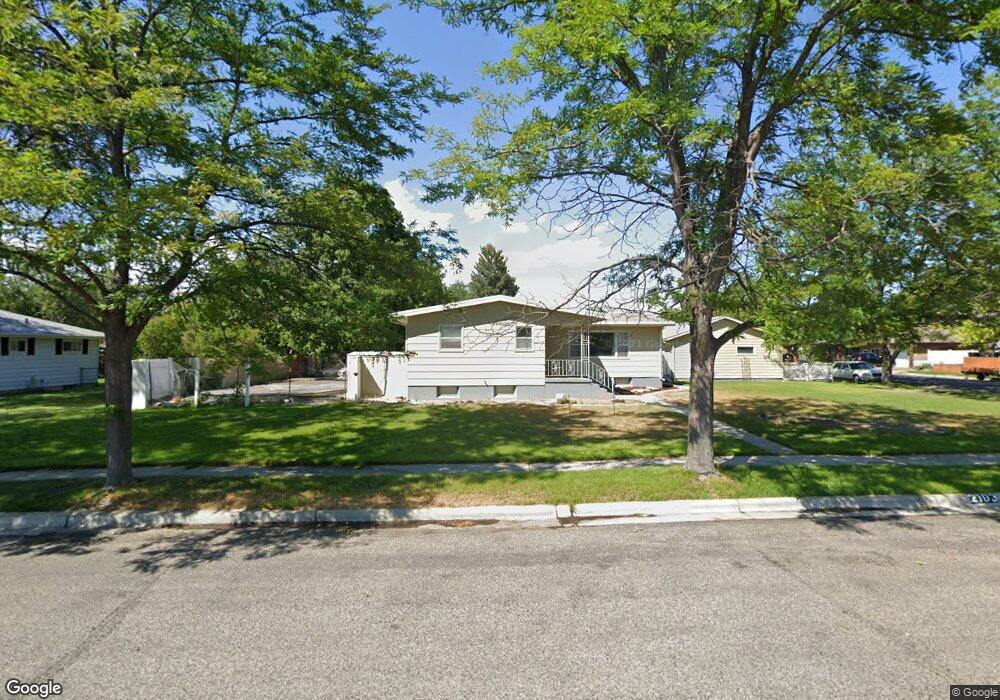
2103 Hewitt Dr Billings, MT 59102
West End NeighborhoodEstimated Value: $360,000 - $396,848
4
Beds
3
Baths
2,728
Sq Ft
$137/Sq Ft
Est. Value
About This Home
This home is located at 2103 Hewitt Dr, Billings, MT 59102 and is currently estimated at $373,462, approximately $136 per square foot. 2103 Hewitt Dr is a home located in Yellowstone County with nearby schools including Miles Avenue School, Will James Junior High School, and Billings West High School.
Ownership History
Date
Name
Owned For
Owner Type
Purchase Details
Closed on
Mar 23, 2018
Sold by
Borich Nick
Bought by
Burns Jesse R and Burns Holly C
Current Estimated Value
Home Financials for this Owner
Home Financials are based on the most recent Mortgage that was taken out on this home.
Original Mortgage
$288,799
Outstanding Balance
$247,595
Interest Rate
4.4%
Mortgage Type
New Conventional
Estimated Equity
$125,867
Purchase Details
Closed on
Feb 9, 2017
Sold by
First Am Title Co Of Mont A
Bought by
Reverse Mtg Solutions Inc
Home Financials for this Owner
Home Financials are based on the most recent Mortgage that was taken out on this home.
Interest Rate
4.17%
Purchase Details
Closed on
Jul 31, 2008
Sold by
Godfrey Christopher H and Godfrey Kristin E
Bought by
Wanner Virginia C
Purchase Details
Closed on
Jun 13, 2008
Sold by
Wanner Virginia C
Bought by
Wanner Virginia C and Godfrey Christopher H
Create a Home Valuation Report for This Property
The Home Valuation Report is an in-depth analysis detailing your home's value as well as a comparison with similar homes in the area
Home Values in the Area
Average Home Value in this Area
Purchase History
| Date | Buyer | Sale Price | Title Company |
|---|---|---|---|
| Burns Jesse R | -- | -- | |
| Reverse Mtg Solutions Inc | $172,733 | -- | |
| Wanner Virginia C | -- | None Available | |
| Wanner Virginia C | -- | None Available |
Source: Public Records
Mortgage History
| Date | Status | Borrower | Loan Amount |
|---|---|---|---|
| Open | Burns Jesse R | $288,799 | |
| Previous Owner | Reverse Mtg Solutions Inc | -- |
Source: Public Records
Tax History
| Year | Tax Paid | Tax Assessment Tax Assessment Total Assessment is a certain percentage of the fair market value that is determined by local assessors to be the total taxable value of land and additions on the property. | Land | Improvement |
|---|---|---|---|---|
| 2025 | $3,503 | $390,100 | $66,244 | $323,856 |
| 2024 | $3,503 | $357,500 | $53,151 | $304,349 |
| 2023 | $3,517 | $357,500 | $53,151 | $304,349 |
| 2022 | $2,360 | $249,900 | $0 | $0 |
| 2021 | $2,692 | $249,900 | $0 | $0 |
| 2020 | $2,726 | $243,500 | $0 | $0 |
| 2019 | $2,603 | $243,500 | $0 | $0 |
| 2018 | $2,647 | $244,100 | $0 | $0 |
| 2017 | $2,200 | $237,600 | $0 | $0 |
| 2016 | $916 | $232,700 | $0 | $0 |
| 2015 | $896 | $232,700 | $0 | $0 |
| 2014 | $531 | $90,736 | $0 | $0 |
Source: Public Records
Map
Nearby Homes
- 2201 Hewitt Dr
- 0 Wyatt Cir Unit 356590
- 2300 Clark Ave
- 2124 Lewis Ave
- 1925 Yellowstone Ave
- 2422 Miles Ave
- 16 19th St W
- 1736 Broadwater Ave
- 1147 18th St W Unit 3
- 1705 Clark Ave
- 2636 Custer Ave
- 1823 Alderson Ave
- 2645 Custer Ave
- 1627 Yellowstone Ave
- 1704 Burlington Ave
- 1723 Alderson Ave
- 2 Mcbride St
- 1537 Wyoming Ave Unit D
- 1540 Yellowstone Ave Unit D
- 2429 Avenue B
Your Personal Tour Guide
Ask me questions while you tour the home.