2103 Whitman Way Corona, CA 92880
North Corona NeighborhoodEstimated Value: $913,032 - $1,008,000
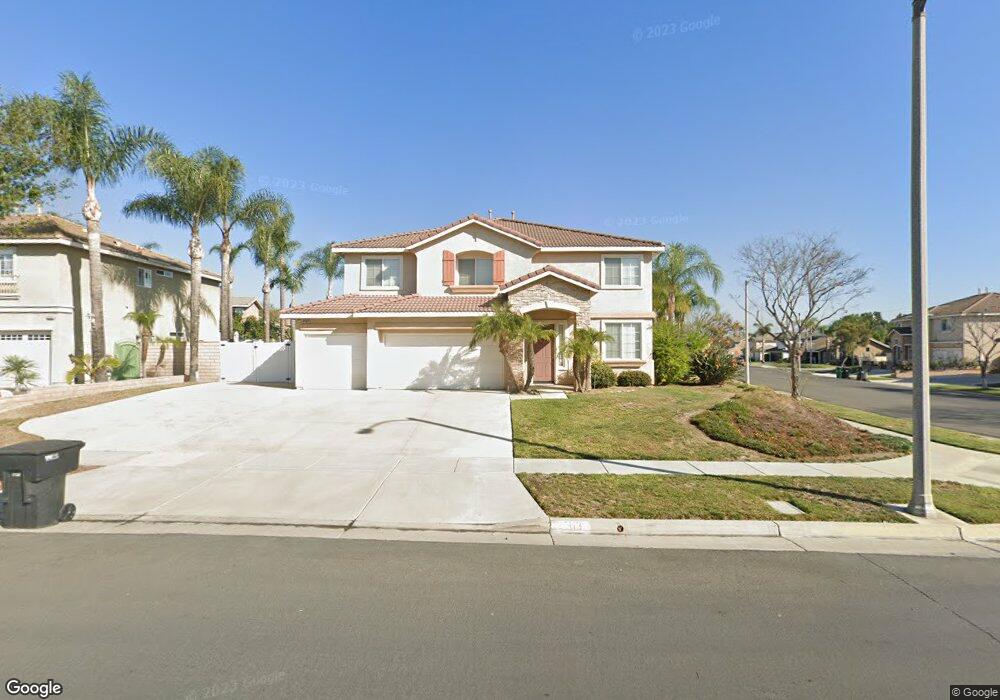
About This Home
This home is located at 2103 Whitman Way, Corona, CA 92880 and is currently estimated at $963,008, approximately $317 per square foot. 2103 Whitman Way is a home located in Riverside County with nearby schools including George Washington Elementary, Auburndale Intermediate, and Norco High School.
Ownership History
We collect this data history from publicly available records. To have your information removed, we recommend requesting removal directly through your county’s website.
Purchase Details
Home Financials for this Owner
Home Financials are based on the most recent Mortgage that was taken out on this home.Purchase Details
Home Financials for this Owner
Home Financials are based on the most recent Mortgage that was taken out on this home.Home Values in the Area
Average Home Value in this Area
Purchase History
We collect this data history from publicly available records. To have your information removed, we recommend requesting removal directly through your county’s website.
| Date | Buyer | Sale Price | Title Company |
|---|---|---|---|
| -- | Pacific Coast Title | ||
| $254,000 | Chicago Title Co |
Mortgage History
We collect this data history from publicly available records. To have your information removed, we recommend requesting removal directly through your county’s website.
| Date | Status | Borrower | Loan Amount |
|---|---|---|---|
| Open | $466,500 | ||
| Previous Owner | $228,100 |
Tax History
We collect this data history from publicly available records. To have your information removed, we recommend requesting removal directly through your county’s website.
| Year | Tax Paid | Tax Assessment Tax Assessment Total Assessment is a certain percentage of the fair market value that is determined by local assessors to be the total taxable value of land and additions on the property. | Land | Improvement |
|---|---|---|---|---|
| 2025 | $5,378 | $397,229 | $78,370 | $318,859 |
| 2023 | $5,378 | $381,806 | $75,328 | $306,478 |
| 2022 | $5,197 | $374,320 | $73,851 | $300,469 |
| 2021 | $5,093 | $366,981 | $72,403 | $294,578 |
| 2020 | $5,012 | $363,219 | $71,661 | $291,558 |
| 2019 | $4,899 | $178,048 | $35,127 | $142,921 |
| 2018 | $4,790 | $349,117 | $68,880 | $280,237 |
| 2017 | $6,376 | $342,273 | $67,530 | $274,743 |
| 2016 | $4,731 | $335,562 | $66,206 | $269,356 |
| 2015 | $4,571 | $330,523 | $65,212 | $265,311 |
| 2014 | $4,448 | $324,051 | $63,936 | $260,115 |
Map
- 980 Hemingway Dr
- 1815 Myrtle St
- 1813 Chesapeake Way
- 1791 Greenview Ave
- 911 Homestead Rd
- 1309 Oxford Cir
- 1019 Meadowview Ct
- 866 Homestead Rd
- 1351 Catherine Cir
- 1268 Dale Cir
- 2386 Hialeah Cir
- 4058 Sundance Ln
- 2670 Vine Ave
- 1452 Granada Ave
- 974 Nottingham Dr
- 3998 Bluff St
- 3373 Dales Dr
- 3441 Rocking rm Ln
- 915 Auburndale St
- 3696 Bluff St
- 2115 Whitman Way
- 2138 Bowdoin St
- 2144 Bowdoin St
- 2127 Whitman Way
- 983 Cornerstone Way
- 2150 Bowdoin St
- 2110 Whitman Way
- 987 Cornerstone Way
- 2120 Whitman Way
- 979 Cornerstone Way
- 991 Cornerstone Way
- 2139 Whitman Way
- 2156 Bowdoin St
- 2130 Whitman Way
- 975 Cornerstone Way
- 1028 Cornerstone Way
- 2140 Whitman Way
- 2151 Whitman Way
- 2111 Shelley Cir
- 2162 Bowdoin St
Ask me questions while you tour the home.