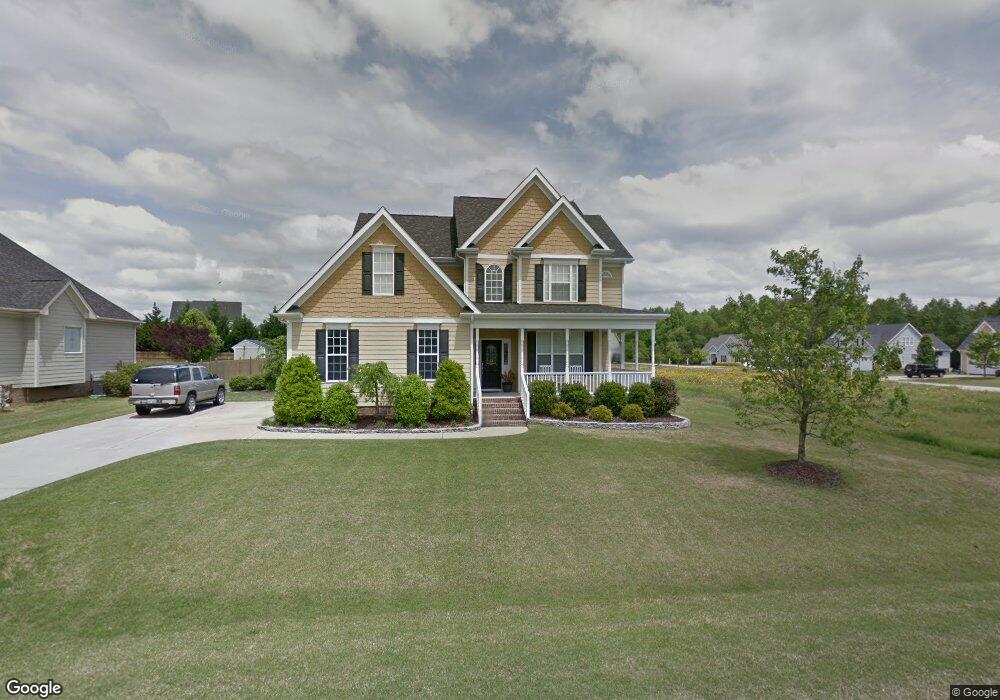
2104 Conroy Way Willow Spring, NC 27592
Estimated Value: $484,634 - $552,000
3
Beds
3
Baths
2,286
Sq Ft
$230/Sq Ft
Est. Value
About This Home
This home is located at 2104 Conroy Way, Willow Spring, NC 27592 and is currently estimated at $524,909, approximately $229 per square foot. 2104 Conroy Way is a home located in Wake County with nearby schools including Willow Springs Elementary School.
Ownership History
Date
Name
Owned For
Owner Type
Purchase Details
Closed on
Oct 13, 2014
Sold by
Yarnell Donald J and Yarnell Casey L
Bought by
Hardison Travis S and Hardison Alyson L
Current Estimated Value
Home Financials for this Owner
Home Financials are based on the most recent Mortgage that was taken out on this home.
Original Mortgage
$213,183
Outstanding Balance
$163,796
Interest Rate
4.16%
Mortgage Type
New Conventional
Estimated Equity
$361,113
Purchase Details
Closed on
Aug 17, 2006
Sold by
Davidson Home Crafters Inc
Bought by
Yarnell Donald J and Powell Casey L
Home Financials for this Owner
Home Financials are based on the most recent Mortgage that was taken out on this home.
Original Mortgage
$203,600
Interest Rate
6.71%
Mortgage Type
Purchase Money Mortgage
Purchase Details
Closed on
Oct 28, 2005
Sold by
Montclair Llc
Bought by
Davidson Home Crafters Inc
Home Financials for this Owner
Home Financials are based on the most recent Mortgage that was taken out on this home.
Original Mortgage
$47,500
Interest Rate
5.84%
Mortgage Type
Fannie Mae Freddie Mac
Create a Home Valuation Report for This Property
The Home Valuation Report is an in-depth analysis detailing your home's value as well as a comparison with similar homes in the area
Home Values in the Area
Average Home Value in this Area
Purchase History
| Date | Buyer | Sale Price | Title Company |
|---|---|---|---|
| Hardison Travis S | $247,000 | None Available | |
| Yarnell Donald J | $254,500 | None Available | |
| Davidson Home Crafters Inc | $45,000 | None Available |
Source: Public Records
Mortgage History
| Date | Status | Borrower | Loan Amount |
|---|---|---|---|
| Open | Hardison Travis S | $213,183 | |
| Previous Owner | Yarnell Donald J | $203,600 | |
| Previous Owner | Davidson Home Crafters Inc | $47,500 |
Source: Public Records
Tax History
| Year | Tax Paid | Tax Assessment Tax Assessment Total Assessment is a certain percentage of the fair market value that is determined by local assessors to be the total taxable value of land and additions on the property. | Land | Improvement |
|---|---|---|---|---|
| 2025 | $3,031 | $470,748 | $100,000 | $370,748 |
| 2024 | $2,802 | $447,958 | $100,000 | $347,958 |
Source: Public Records
Map
Nearby Homes
- 7301 Ladora Dr
- 7101 Numa Cir
- 2416 Whitset Place
- 7033 Leando Dr
- 2416 Eddie Howard Rd
- 7340 Shady Stroll Ln
- 1617 Kendall Hill Rd
- 1628 Meadowfern Place
- 812 Comice Pear Way
- 841 Comice Pear Way
- 837 Comice Pear Way
- 905 Comice Pear Way
- 829 Comice Pear Way
- 824 Comice Pear Way
- 830 Comice Pear Way
- 821 Comice Pear Way
- 1637 Meadowfern Place
- 817 Comice Pear Way
- 833 Comice Pear Way
- 840 Comice Pear Way
- 2108 Conroy Way
- 2100 Conroy Way
- 1524 Struble Cir
- 1512 Struble Cir
- 2112 Conroy Way
- 7331 Pekin Dr
- 2105 Conroy Way
- 1521 Struble Cir
- 2109 Conroy Way
- 2101 Conroy Way
- 1525 Struble Cir
- 1601 Struble Cir
- 1500 Struble Cir
- 2116 Conroy Way
- 1517 Struble Cir
- 7335 Pekin Dr
- 1605 Struble Cir
- 1513 Struble Cir
- 2117 Conroy Way
- 2120 Conroy Way
Your Personal Tour Guide
Ask me questions while you tour the home.