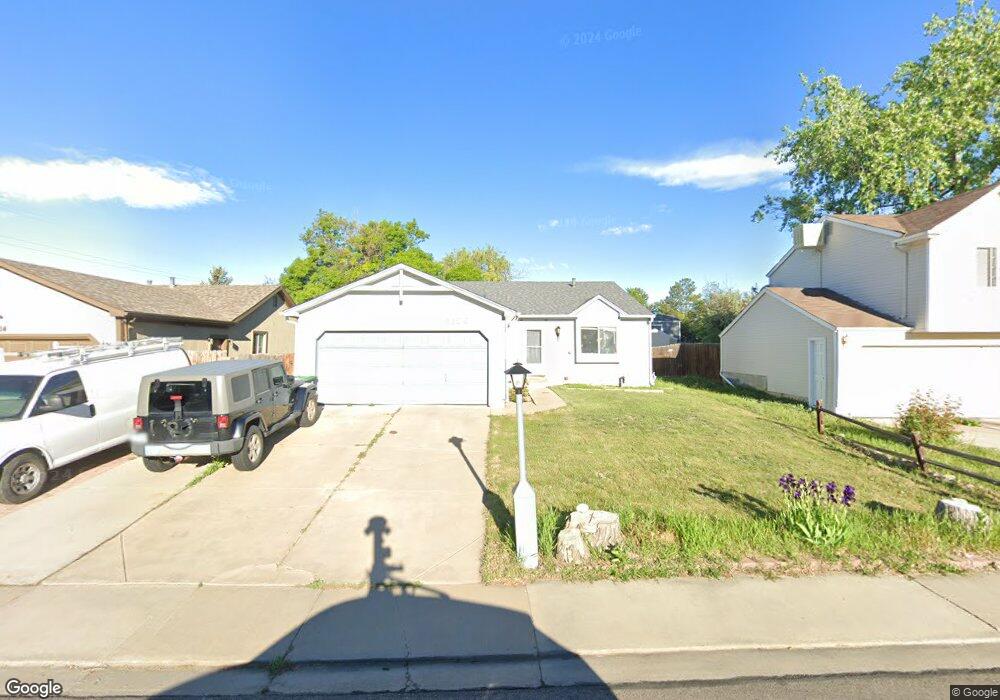
2106 Hackberry Cir Longmont, CO 80501
Garden Acres NeighborhoodEstimated Value: $402,311 - $442,000
3
Beds
2
Baths
1,280
Sq Ft
$332/Sq Ft
Est. Value
About This Home
This home is located at 2106 Hackberry Cir, Longmont, CO 80501 and is currently estimated at $424,328, approximately $331 per square foot. 2106 Hackberry Cir is a home located in Boulder County with nearby schools including Sanborn Elementary School, Longs Peak Middle School, and Longmont High School.
Ownership History
Date
Name
Owned For
Owner Type
Purchase Details
Closed on
Mar 1, 2014
Sold by
Westerlind Jon S and Westerlind Linda
Bought by
Westerlind Linda
Current Estimated Value
Purchase Details
Closed on
Oct 4, 2001
Sold by
Windemere Realty Inc
Bought by
Westerlind Jon S and Westerlind Linda
Home Financials for this Owner
Home Financials are based on the most recent Mortgage that was taken out on this home.
Original Mortgage
$149,600
Outstanding Balance
$43,904
Interest Rate
3.45%
Estimated Equity
$380,424
Purchase Details
Closed on
Aug 31, 2001
Sold by
Pyatt Nahman Scott Thomas and Pyatt Nahman Karen
Bought by
Windemere Realty Inc
Home Financials for this Owner
Home Financials are based on the most recent Mortgage that was taken out on this home.
Original Mortgage
$149,600
Outstanding Balance
$43,904
Interest Rate
3.45%
Estimated Equity
$380,424
Purchase Details
Closed on
Sep 14, 1993
Sold by
Nahman Karen Pyatt
Bought by
Pyatt Nahman Scott Thomas Karen
Purchase Details
Closed on
Jun 30, 1993
Bought by
Westerlind Linda Living Tr
Create a Home Valuation Report for This Property
The Home Valuation Report is an in-depth analysis detailing your home's value as well as a comparison with similar homes in the area
Home Values in the Area
Average Home Value in this Area
Purchase History
| Date | Buyer | Sale Price | Title Company |
|---|---|---|---|
| Westerlind Linda | -- | None Available | |
| Westerlind Jon S | $187,000 | First American Heritage Titl | |
| Windemere Realty Inc | $185,000 | First American Heritage Titl | |
| Pyatt Nahman Scott Thomas Karen | -- | -- | |
| Westerlind Linda Living Tr | -- | -- |
Source: Public Records
Mortgage History
| Date | Status | Borrower | Loan Amount |
|---|---|---|---|
| Open | Westerlind Jon S | $149,600 | |
| Closed | Windemere Realty Inc | $167,783 |
Source: Public Records
Tax History
| Year | Tax Paid | Tax Assessment Tax Assessment Total Assessment is a certain percentage of the fair market value that is determined by local assessors to be the total taxable value of land and additions on the property. | Land | Improvement |
|---|---|---|---|---|
| 2025 | $2,287 | $25,219 | $5,063 | $20,156 |
| 2024 | $2,287 | $25,219 | $5,063 | $20,156 |
| 2023 | $2,256 | $23,906 | $5,682 | $21,909 |
| 2022 | $2,102 | $21,239 | $4,177 | $17,062 |
| 2021 | $2,129 | $21,850 | $4,297 | $17,553 |
| 2020 | $2,059 | $21,193 | $3,718 | $17,475 |
| 2019 | $2,026 | $21,193 | $3,718 | $17,475 |
| 2018 | $1,611 | $16,956 | $3,312 | $13,644 |
| 2017 | $1,589 | $18,746 | $3,662 | $15,084 |
| 2016 | $1,458 | $15,251 | $4,537 | $10,714 |
| 2015 | $1,389 | $12,505 | $3,980 | $8,525 |
| 2014 | $1,168 | $12,505 | $3,980 | $8,525 |
Source: Public Records
Map
Nearby Homes
- 2138 Daley Dr
- 2244 Vivian St
- 2034 Sumac St
- 1912 Rice St
- 2454 Tulip St
- 2140 Sherman St
- 1816 Rice St
- 0 Clyde Ct
- 1554 Ervine Ave
- 2430 Frontier St
- 1851 Trevor Cir
- 2024 Lincoln St
- 2412 Sherman St
- 2104 18th Ave
- 2121 Addie Rose Ln
- 1729 Tulip St
- 2437 Lincoln St
- 1842 Hennington Ct
- 1829 Sweeney Place
- 2057 Falcon Dr
- 2104 Hackberry Cir
- 2108 Hackberry Cir
- 2102 Hackberry Cir
- 2110 Hackberry Cir
- 2182 Hackberry Cir
- 2184 Hackberry Cir
- 2180 Hackberry Cir
- 2186 Hackberry Cir
- 2178 Hackberry Cir
- 2112 Hackberry Cir
- 2107 Hackberry Cir
- 2109 Hackberry Cir
- 2100 Hackberry Cir
- 2105 Hackberry Cir
- 2111 Hackberry Cir
- 2176 Hackberry Cir
- 2188 Hackberry Cir
- 2103 Hackberry Cir
- 2114 Hackberry Cir
- 2113 Hackberry Cir
Your Personal Tour Guide
Ask me questions while you tour the home.